class: center, middle ### Animation with `gganimate` and More Interactivity <img src="img/hero_wall_pink.png" width="800px"/> ### Kelly McConville .large[Math 241 | Week 10 | Spring 2021] --- ## Announcements/Reminders * Lab 7 is posted --- ## Goals for Today * Talk about the Final Project * Discuss issues with found data * Animation with `gganimate` * More interactivity with `plotly` --- ## Looking Ahead Next week we will cover interactivity with `shiny`. <img src="img/shiny.png" width="124" /> --- ### Looking (Much) Further Ahead: 2020-2021 Academic Year * Math 243: Statistical Learning + For a deep dive into predictive models + Fall + Pre-req: Math 141 * Math 343: Statistics Practicum + For practice conducting an empirical research project + Spring + Pre-req: Math 243 or Math 241 * Math 391: Probability Theory + Learn the language of statistical inference + Fall + Pre-req: Math 202 + Math 113 * CSCI 121: CS Fundamentals I + Introduction to CS + Fall/Spring --- ## Final Project * Goals: + Answer a question with data. + Learn and apply a new technique/R package. * Pick your own groups of 1-3 people. + Must pick your group by next Thursday. + Let me know via a DM in Slack if you need help finding a group. * Components + Data wrangling and/or web scraping + Data viz + Something new --- ## Final Project *Something New* Ideas * More advanced text analysis * Learn how to wrangling and join spatial data * New data visualization + Ex: Graph a network with `ggraph` * Modeling technique (that is new to you) + Ex: Regression trees + Ex: Clustering algorithm * Learn to work with a new data type (ex JSON, XML) in R. * **A new data source does not count!** --- ## Lab 6: Cautions of Found Data * **Found data**: Data that someone else collected but is relevant to your research question. -- Example: Data on **all** documented eruptions from the past 10,000 years + Reputable source: Smithsonian Institution's Global Volcanism Program + Big dataset: Around 10,000 eruptions -- **Why is it not a good reflection of ALL eruptions from the past 10,000 years?** <img src="slidesWk10Th_files/figure-html/unnamed-chunk-2-1.png" width="720" /> --- ## Lab 6: Cautions of Found Data * **Found data**: Data that someone else collected but is relevant to your research question. Example: Data on **all** documented eruptions from the past 10,000 years * Morals: + Big does not mean representative. + Always thoroughly explore and inspect the data. --- ## Move Over Nate Silver * [Hans Rosling](https://en.wikipedia.org/wiki/Hans_Rosling) + [The Joy of Stats](https://vimeo.com/18477762) -- 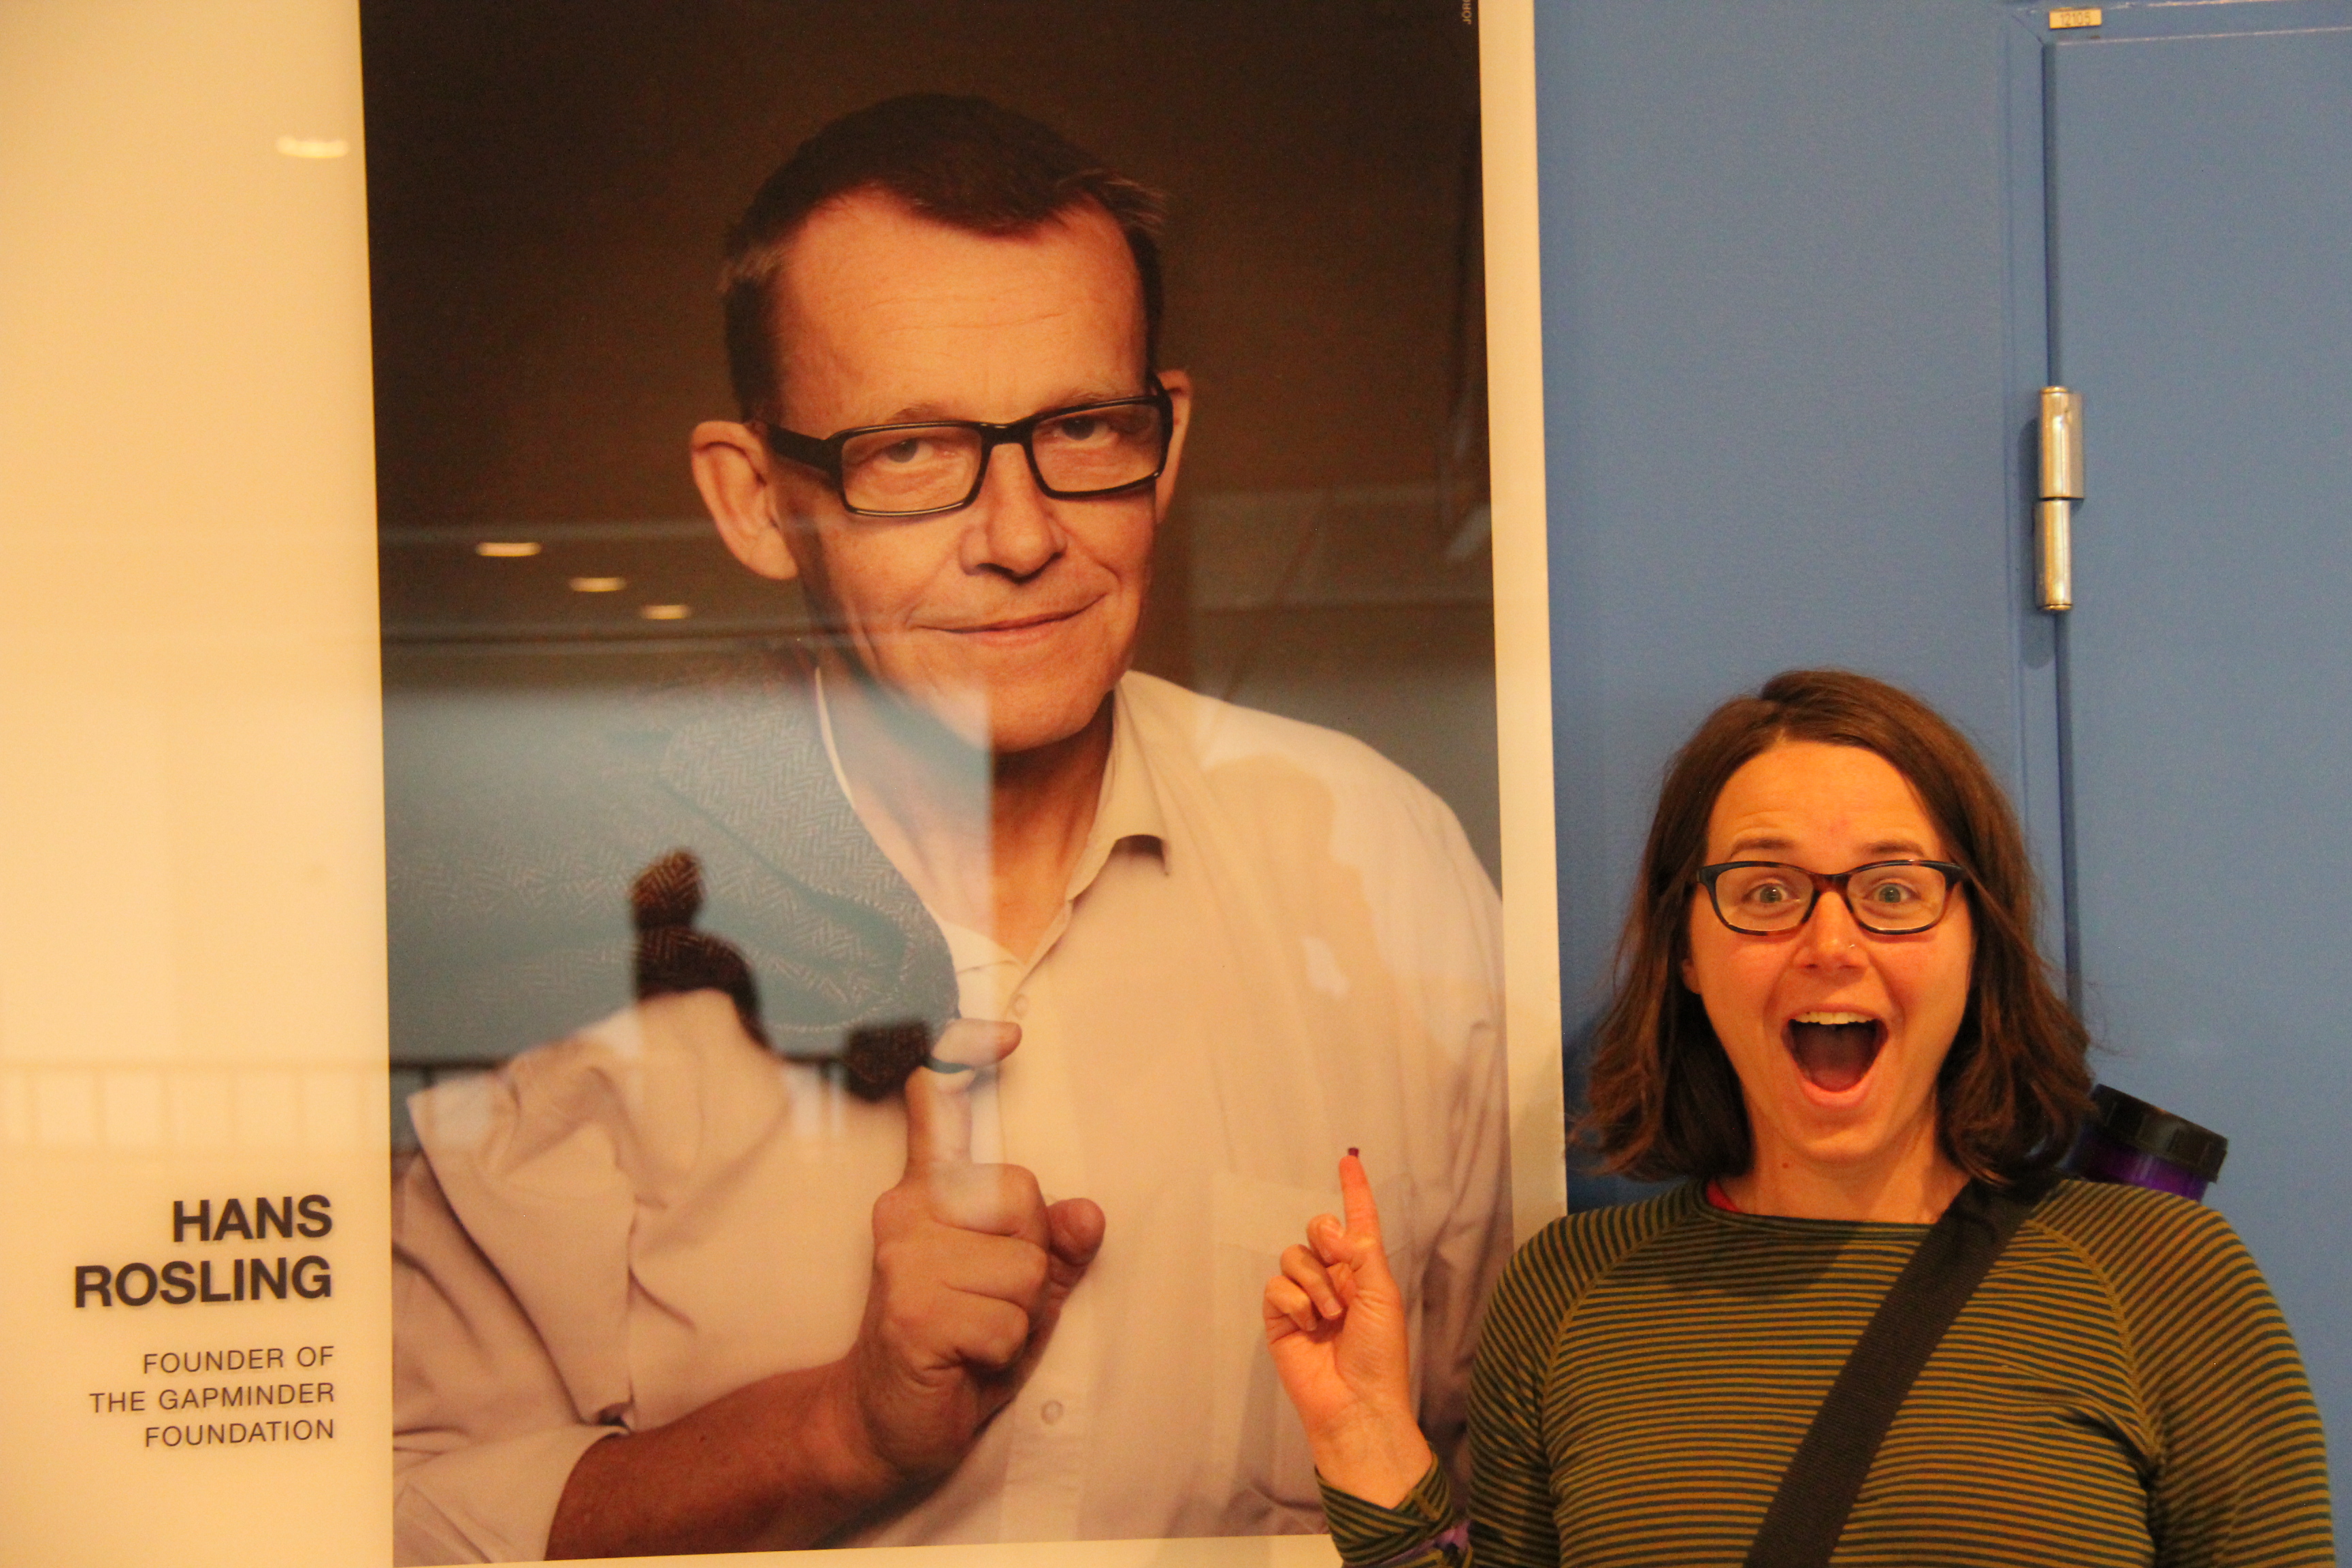 --- ## Math 241 Names * When does each name peak? * Which do you think is more popular now? * Do you think they follow the same trend? ```r library(babynames) roster <- readr::read_csv(here::here("slides/math241names.csv")) %>% pull() baby_math241 <- babynames %>% filter(name %in% roster) %>% group_by(name) %>% summarize(max = max(n)) %>% slice_max(n = 5, order_by = max) %>% select(name) %>% pull() %>% str_to_lower() baby_math241 ``` ``` ## [1] "linda" "william" "jessica" "joshua" "ryan" ``` --- ## Math 241 Names * When does each name peak? * Which do you think is more popular now? * Do you think they follow the same trend? ```r baby_math241_years <- babynames %>% mutate(name = str_to_lower(name)) %>% filter(name %in% baby_math241) %>% group_by(year, name) %>% summarize(n = sum(n)) baby_math241_years ``` ``` ## # A tibble: 658 x 3 ## # Groups: year [138] ## year name n ## <dbl> <chr> <int> ## 1 1880 jessica 7 ## 2 1880 joshua 57 ## 3 1880 linda 27 ## 4 1880 william 9562 ## 5 1881 jessica 7 ## 6 1881 joshua 40 ## 7 1881 linda 38 ## 8 1881 william 8554 ## 9 1882 jessica 8 ## 10 1882 joshua 50 ## # … with 648 more rows ``` --- ## Math 241 Names Animated! 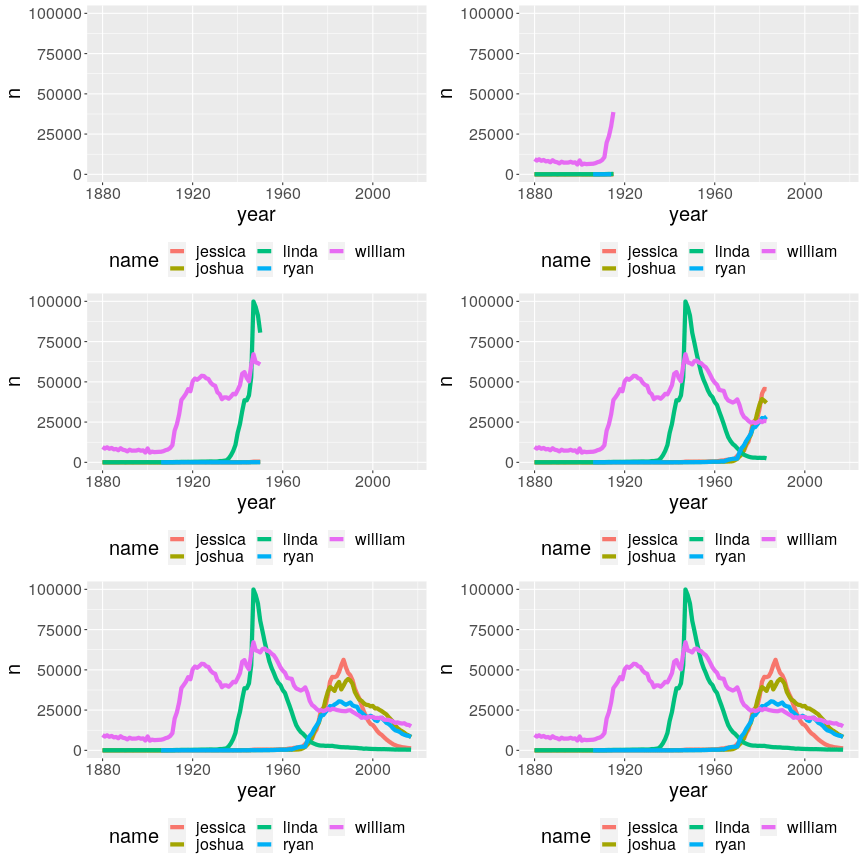<!-- --> --- ## `gganimate` ```r library(gganimate) ``` * Extends `ggplot2` to allow for animation. + Additional layers * Core functions: + `transition_*()`: Defining the variable that controls the change and how it controls the change + `enter/exit*()`: Determining how data enters and exits + `view_*()`: Changing axes + `shadow_*()`: Giving the animation memory + `ease_aes()`: Timing the ease in and out of the animation --- ## Create a Static Version First ```r p <- ggplot(data = baby_math241_years, mapping = aes(x = year, y = n)) + geom_line(aes(color = name), size = 2) + theme(legend.position = "bottom", text = element_text(size=20)) + guides(color = guide_legend(nrow = 2)) p ``` <img src="slidesWk10Th_files/figure-html/unnamed-chunk-7-1.png" width="432" /> --- ### Then Animate! `transition_reveal()`: Adding each new frame on top of the previous frames ```r p_animate <- p + transition_reveal(along = year) p_animate ``` 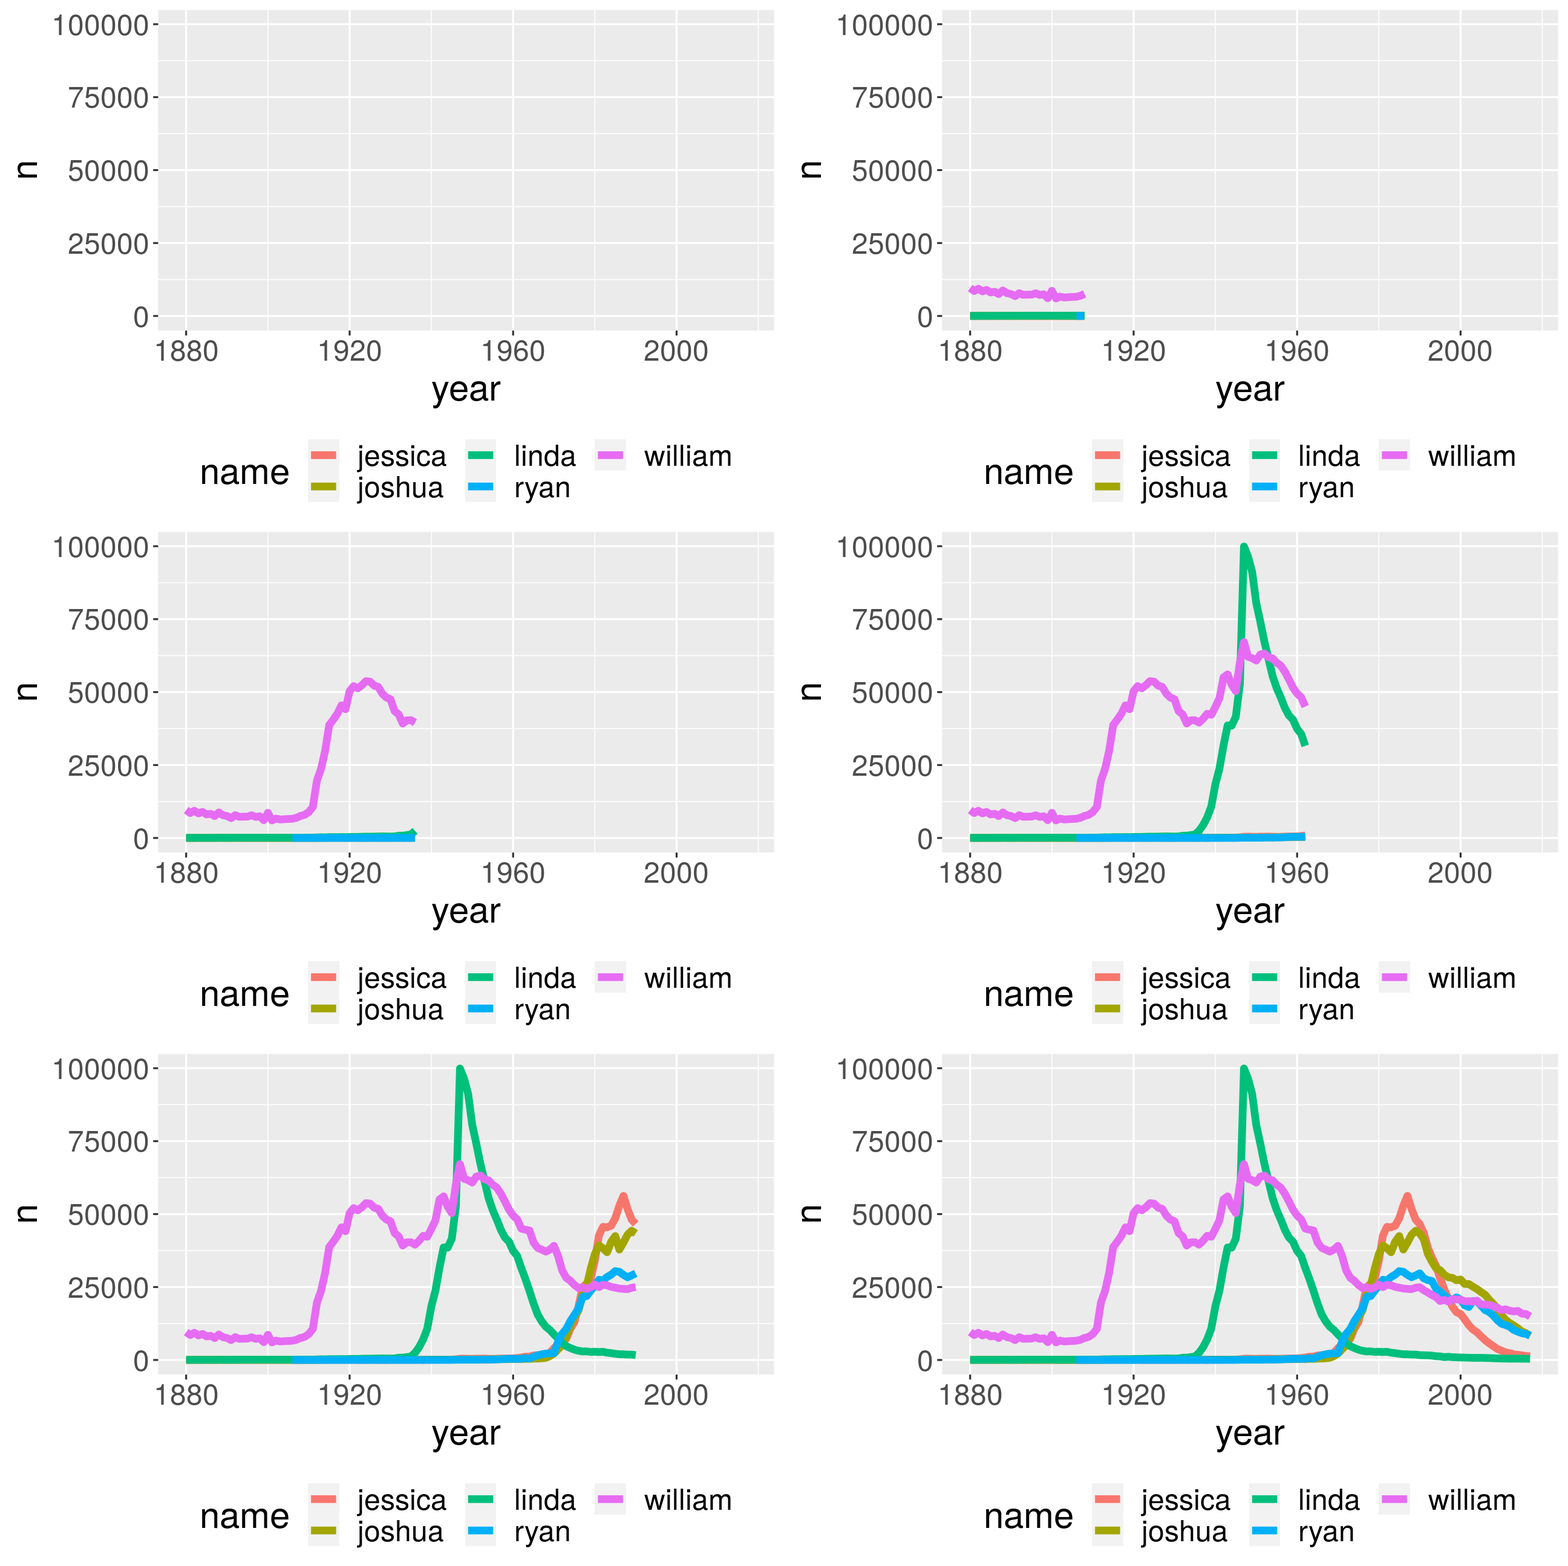<!-- --> --- ### Controlling the Animation ```r p_animate <- p + transition_reveal(year) animate(p_animate, fps = 5, end_pause = 20) ``` 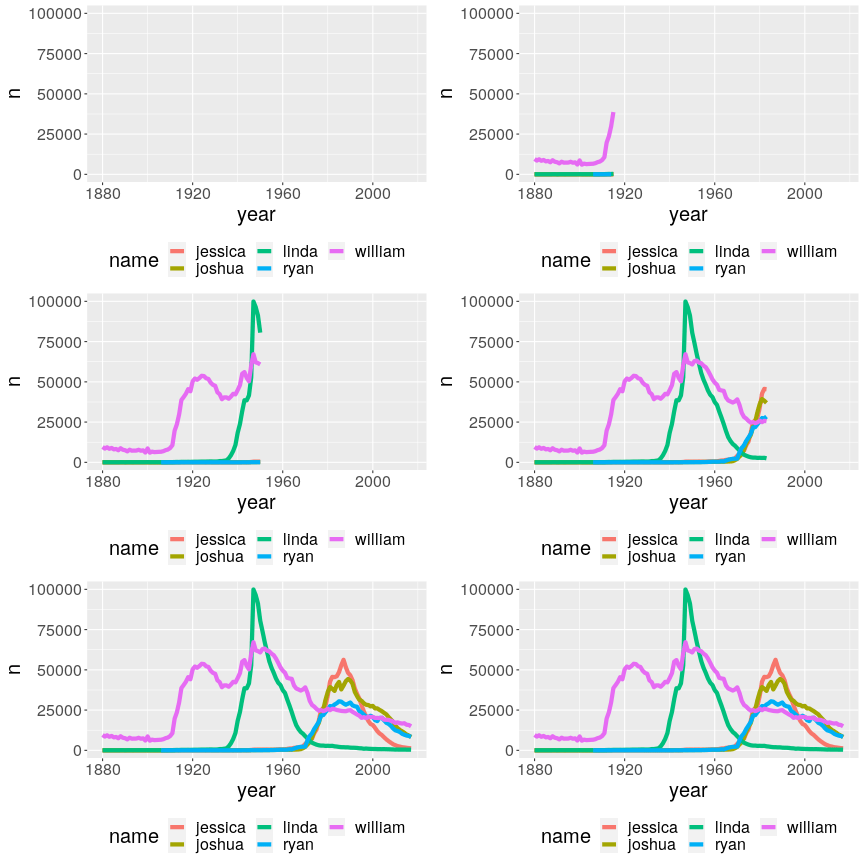<!-- --> --- ## Animate Previous Graphs ```r Eruptions <- read_csv("/home/courses/math241s21/Data/GVP_Eruption_Results.csv") aleutian_box <- c(bottom = 50.977, left = -172.164, top = 59.5617, right = -157.1507) aleutian <- ggmap::get_stamenmap(aleutian_box, maptype = "terrain-background", zoom = 5) Eruptions_aleutian <- Eruptions %>% filter(Longitude > -172.164, Longitude < -157.1507, Latitude > 50.977, Latitude < 59.5617) aleutian_count <- count(Eruptions_aleutian, VolcanoName, Longitude, Latitude) ``` --- ## Animate Previous Graphs ```r library(ggmap) p_aleutian <- aleutian %>% ggmap() + geom_point(data = Eruptions_aleutian, aes(Longitude, Latitude), inherit.aes = FALSE, color = "red") + theme_void() p_aleutian ``` <img src="slidesWk10Th_files/figure-html/unnamed-chunk-11-1.png" width="432" /> --- `transition_time()`: transition length between states set to actual time difference ```r p_aleutian <- p_aleutian + transition_time(time = StartYear) p_aleutian ``` 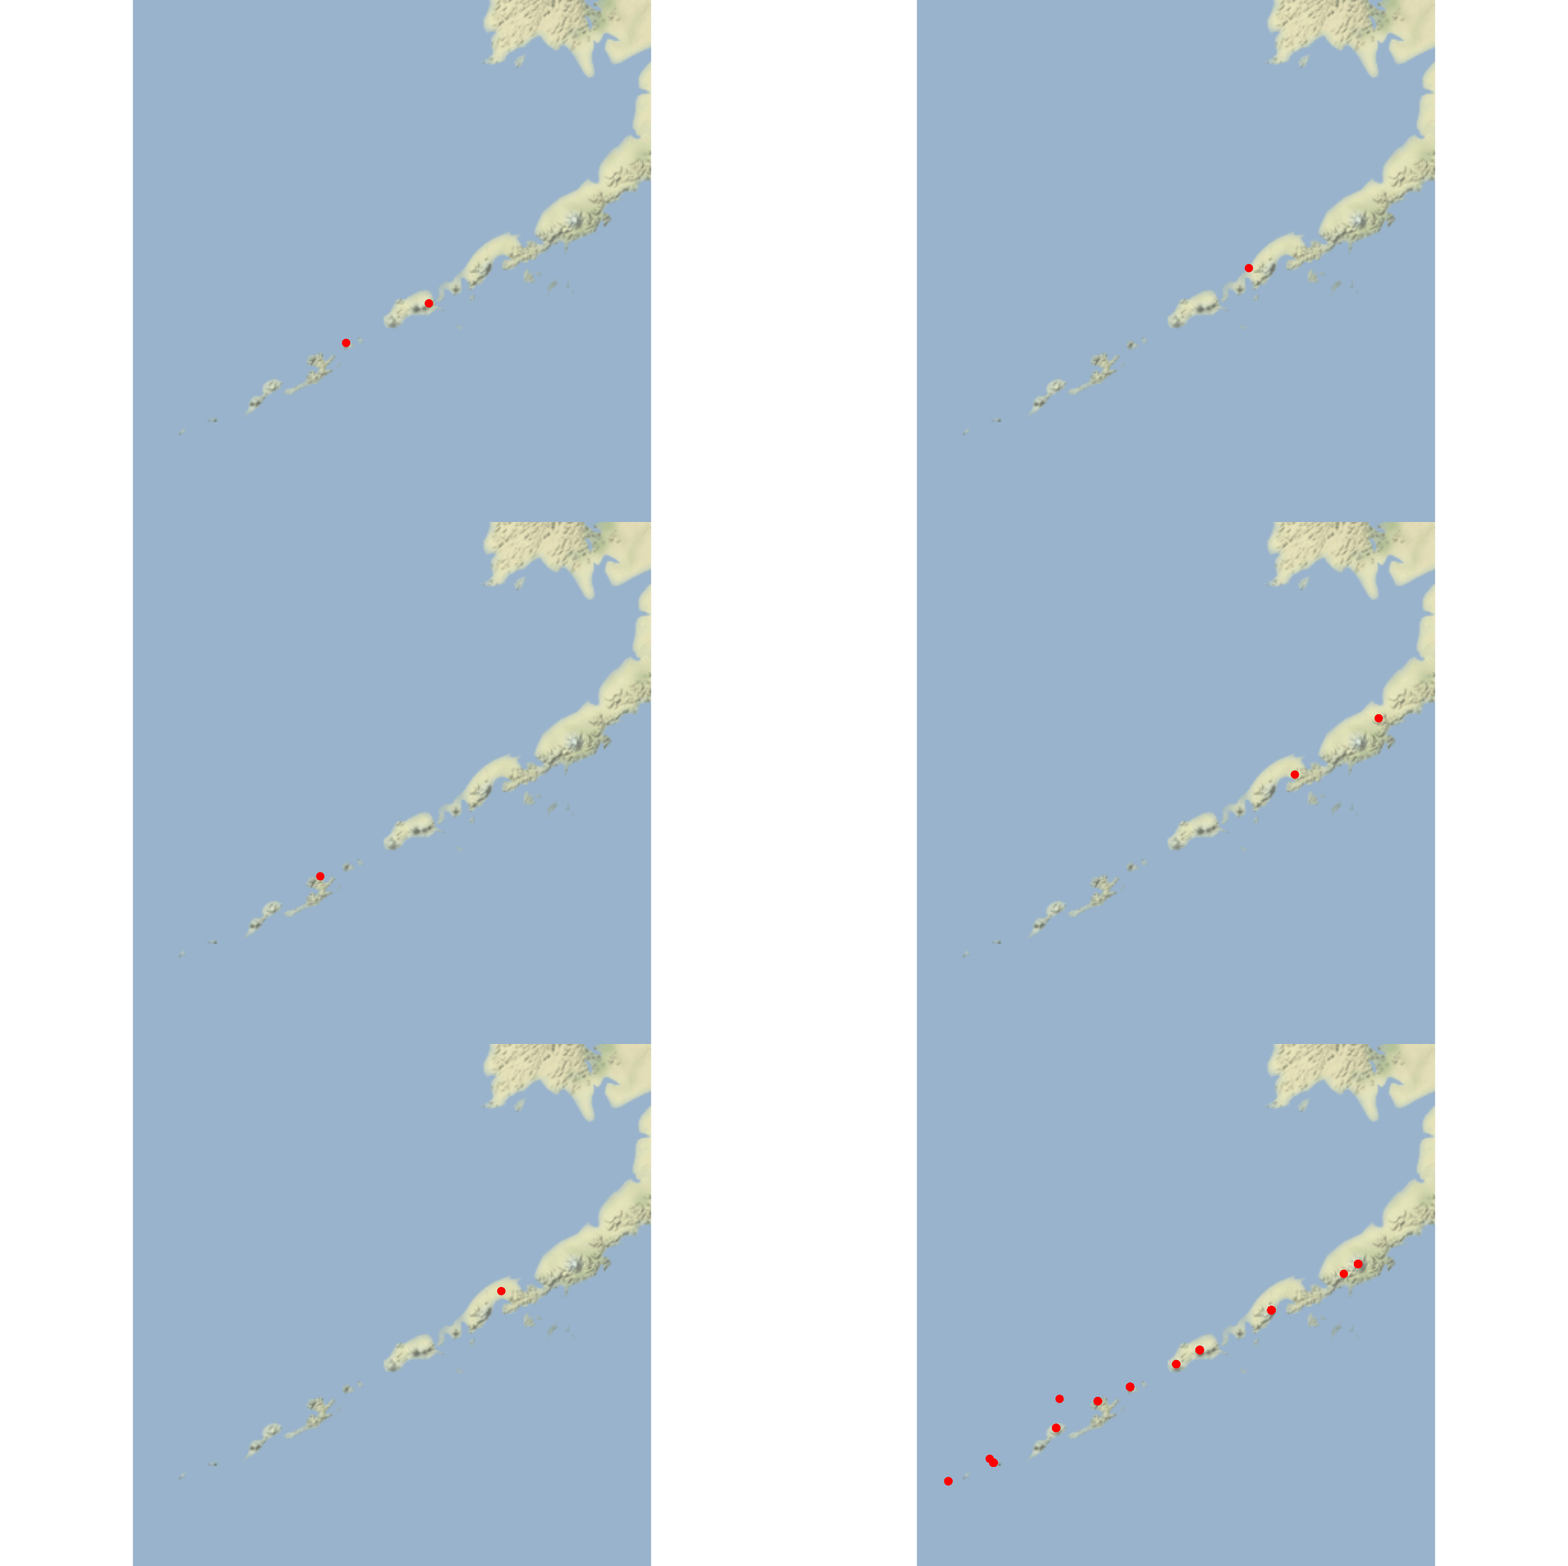<!-- --> --- Impact of `group`? ```r p_aleutian <- aleutian %>% ggmap() + geom_point(data = Eruptions_aleutian, aes(Longitude, Latitude, group = VolcanoName), inherit.aes = FALSE, color = "red") + theme_void() + transition_time(time = StartYear) p_aleutian ``` 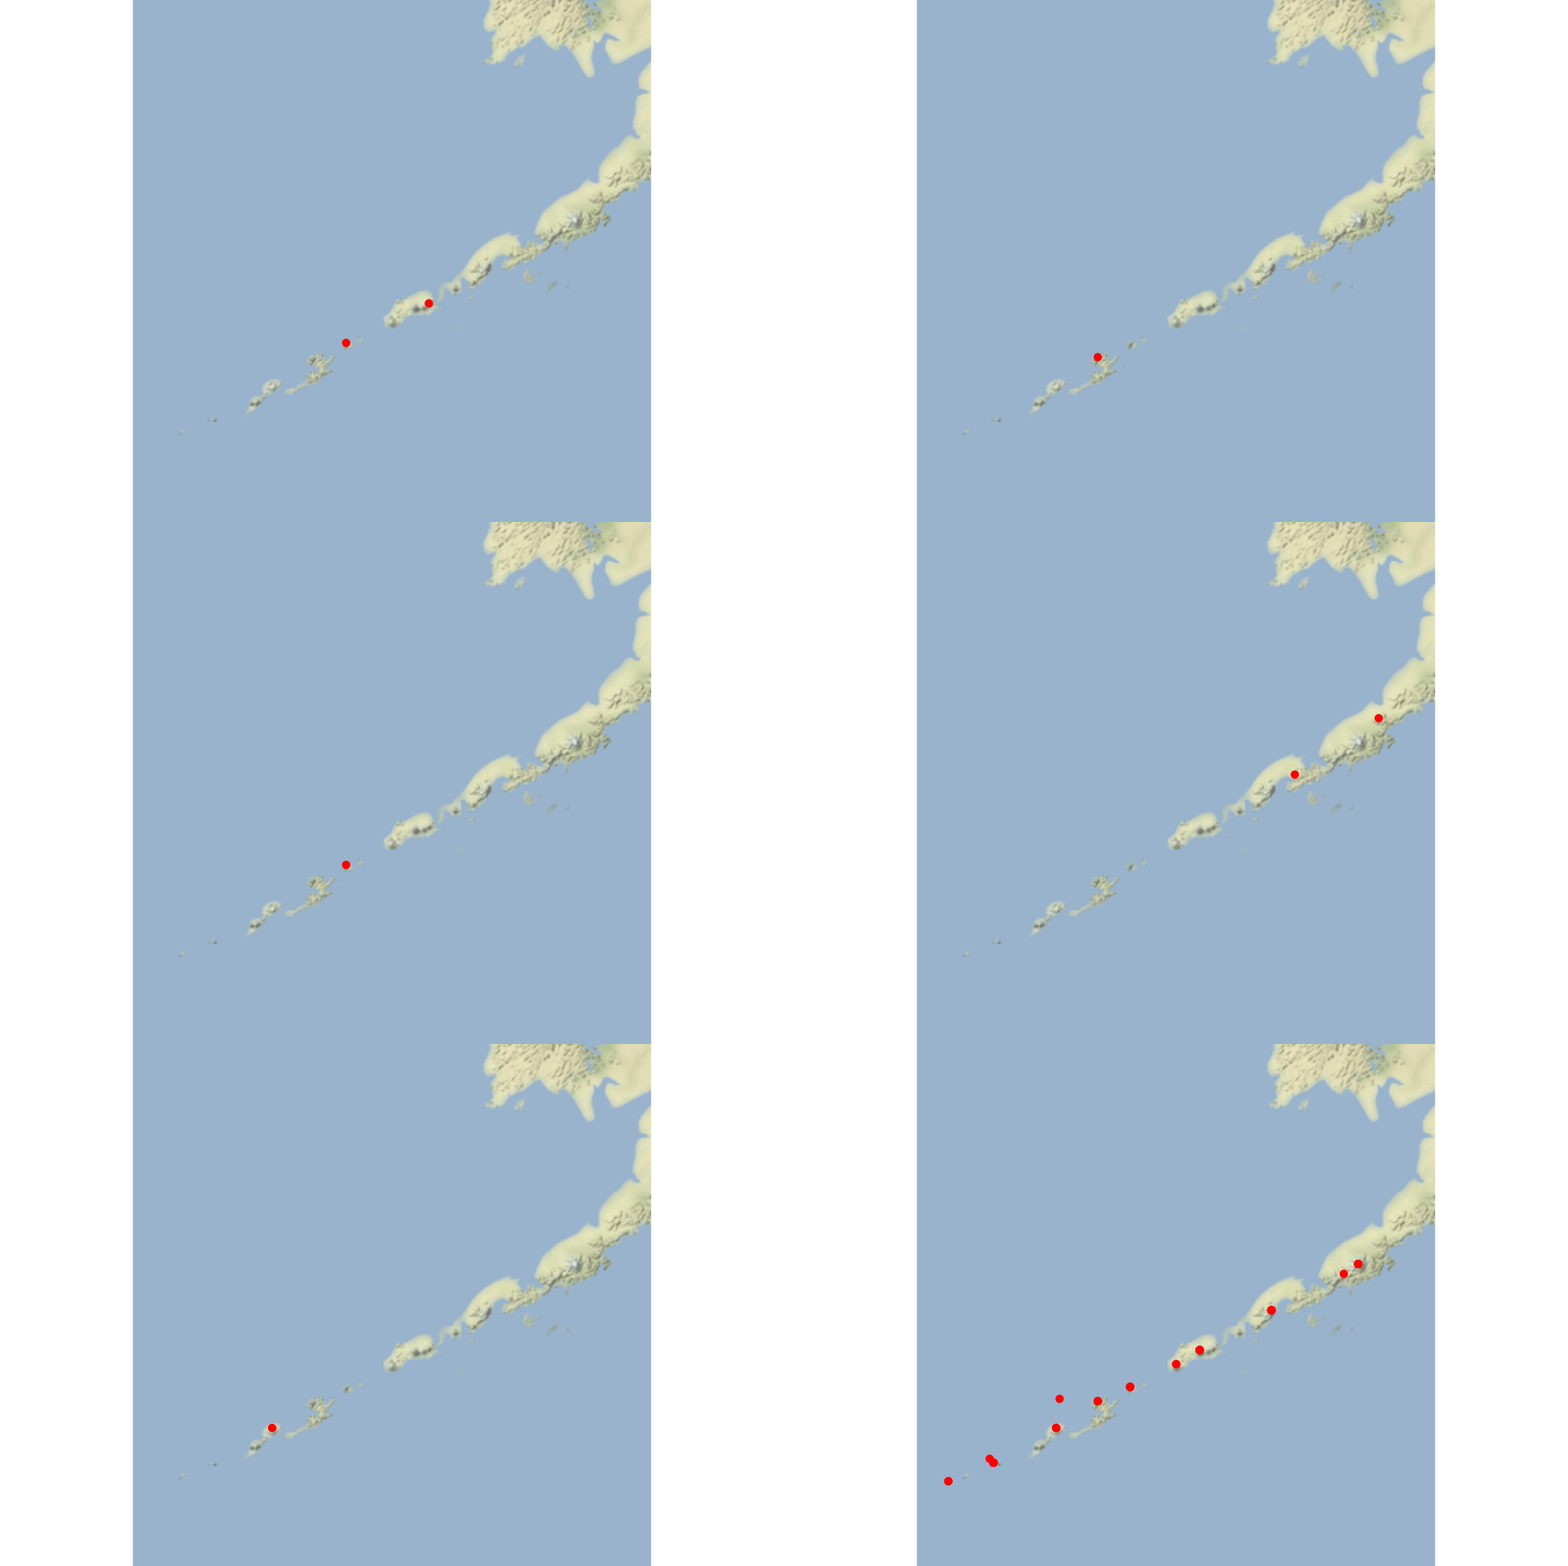<!-- --> --- ## Animate Previous Graph ```r p_aleutian <- aleutian %>% ggmap() + geom_point(data = aleutian_count, aes(Longitude, Latitude, color = n, group = VolcanoName), inherit.aes = FALSE, size = 4) + theme_void() + scale_color_viridis_c() p_aleutian ``` <img src="slidesWk10Th_files/figure-html/unnamed-chunk-14-1.png" width="432" /> --- `transition_states()`: Cycling through the values of a variable ```r p_aleutian <- p_aleutian + transition_states(states = n, transition_length = 3, state_length = 5) p_aleutian ``` 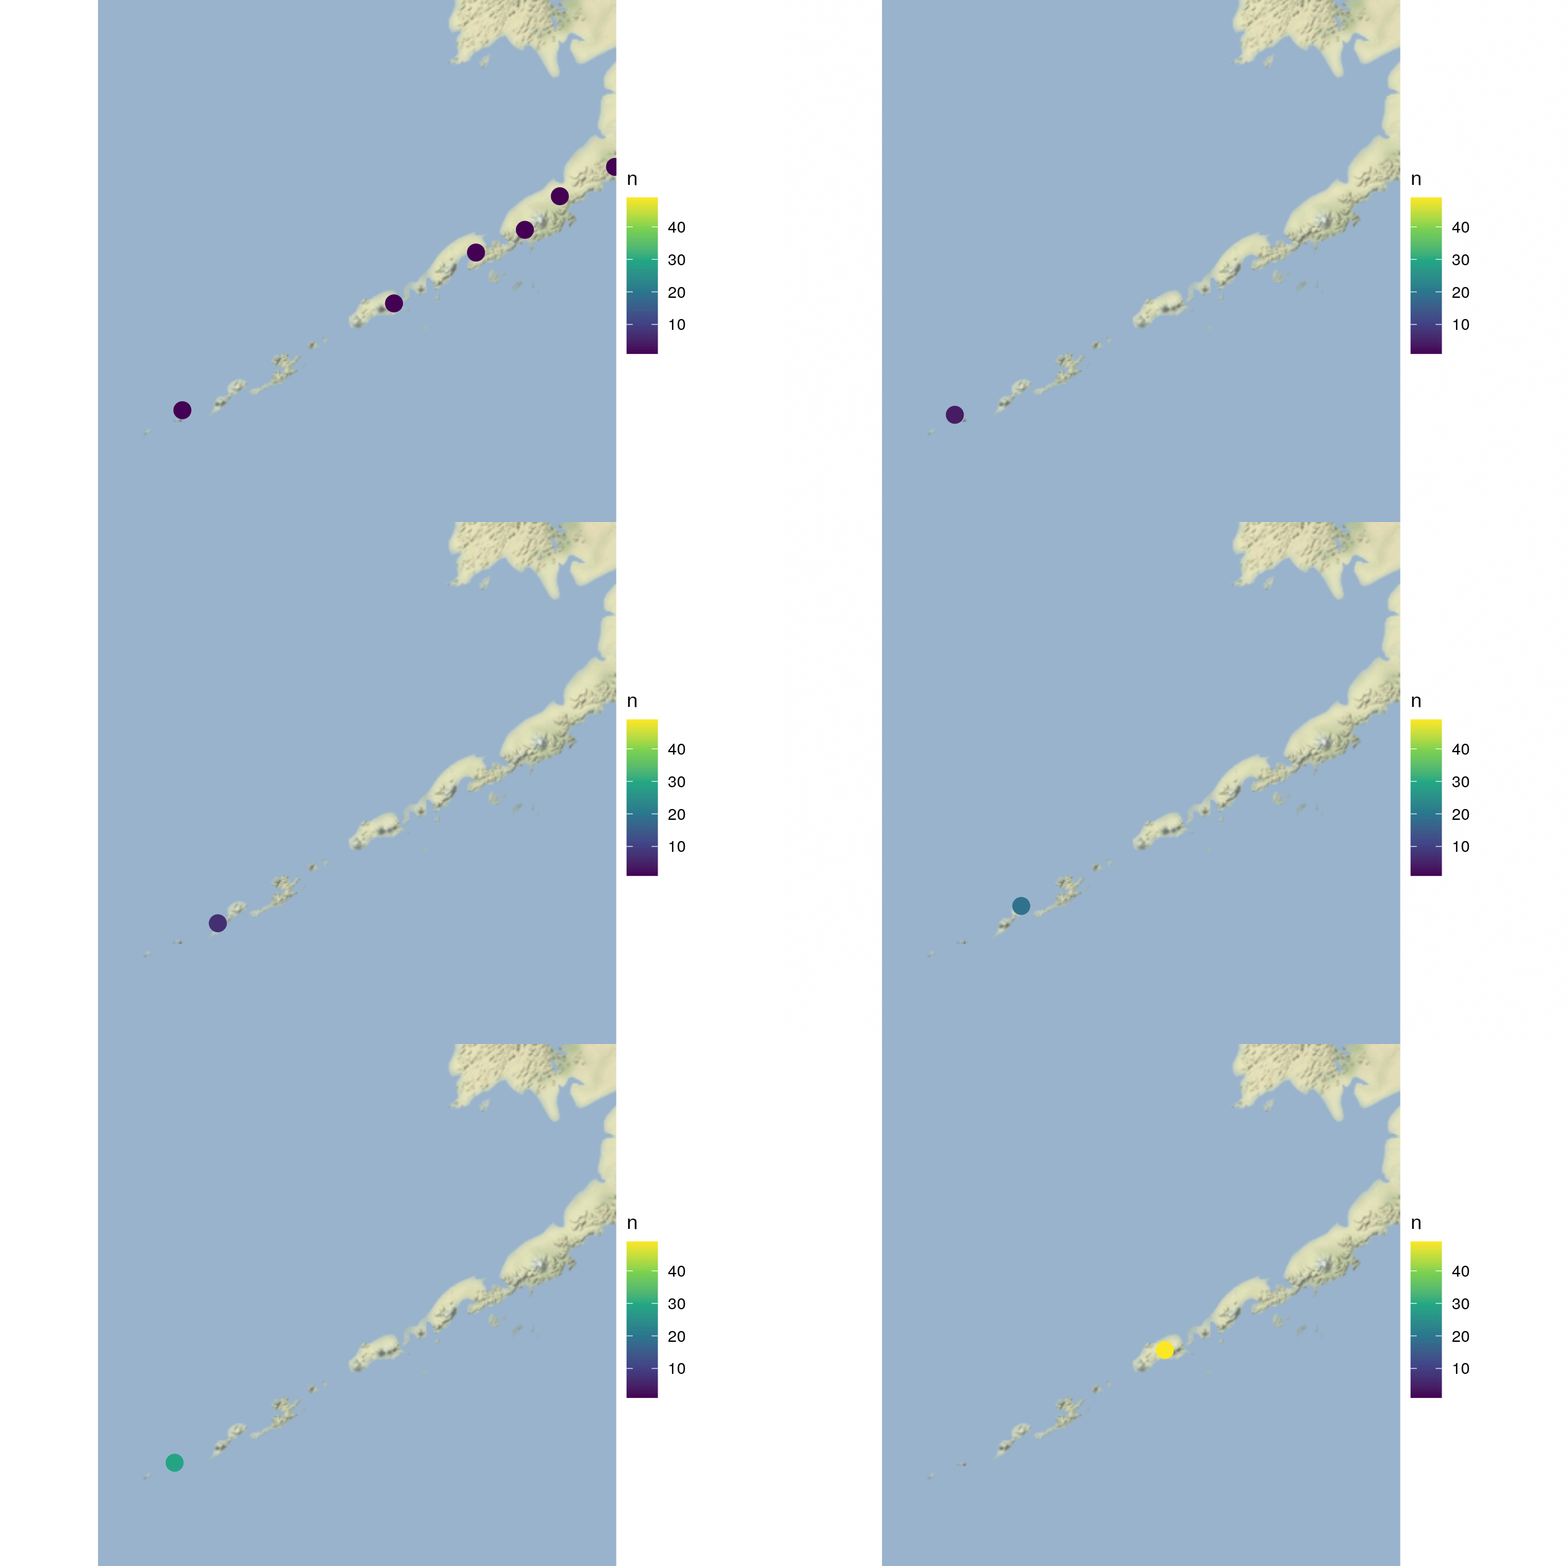<!-- --> --- * Can add labels with `labs()` and `glue` ```r p_aleutian + labs(title = "Volcano has erupted {previous_state} time(s)") ``` 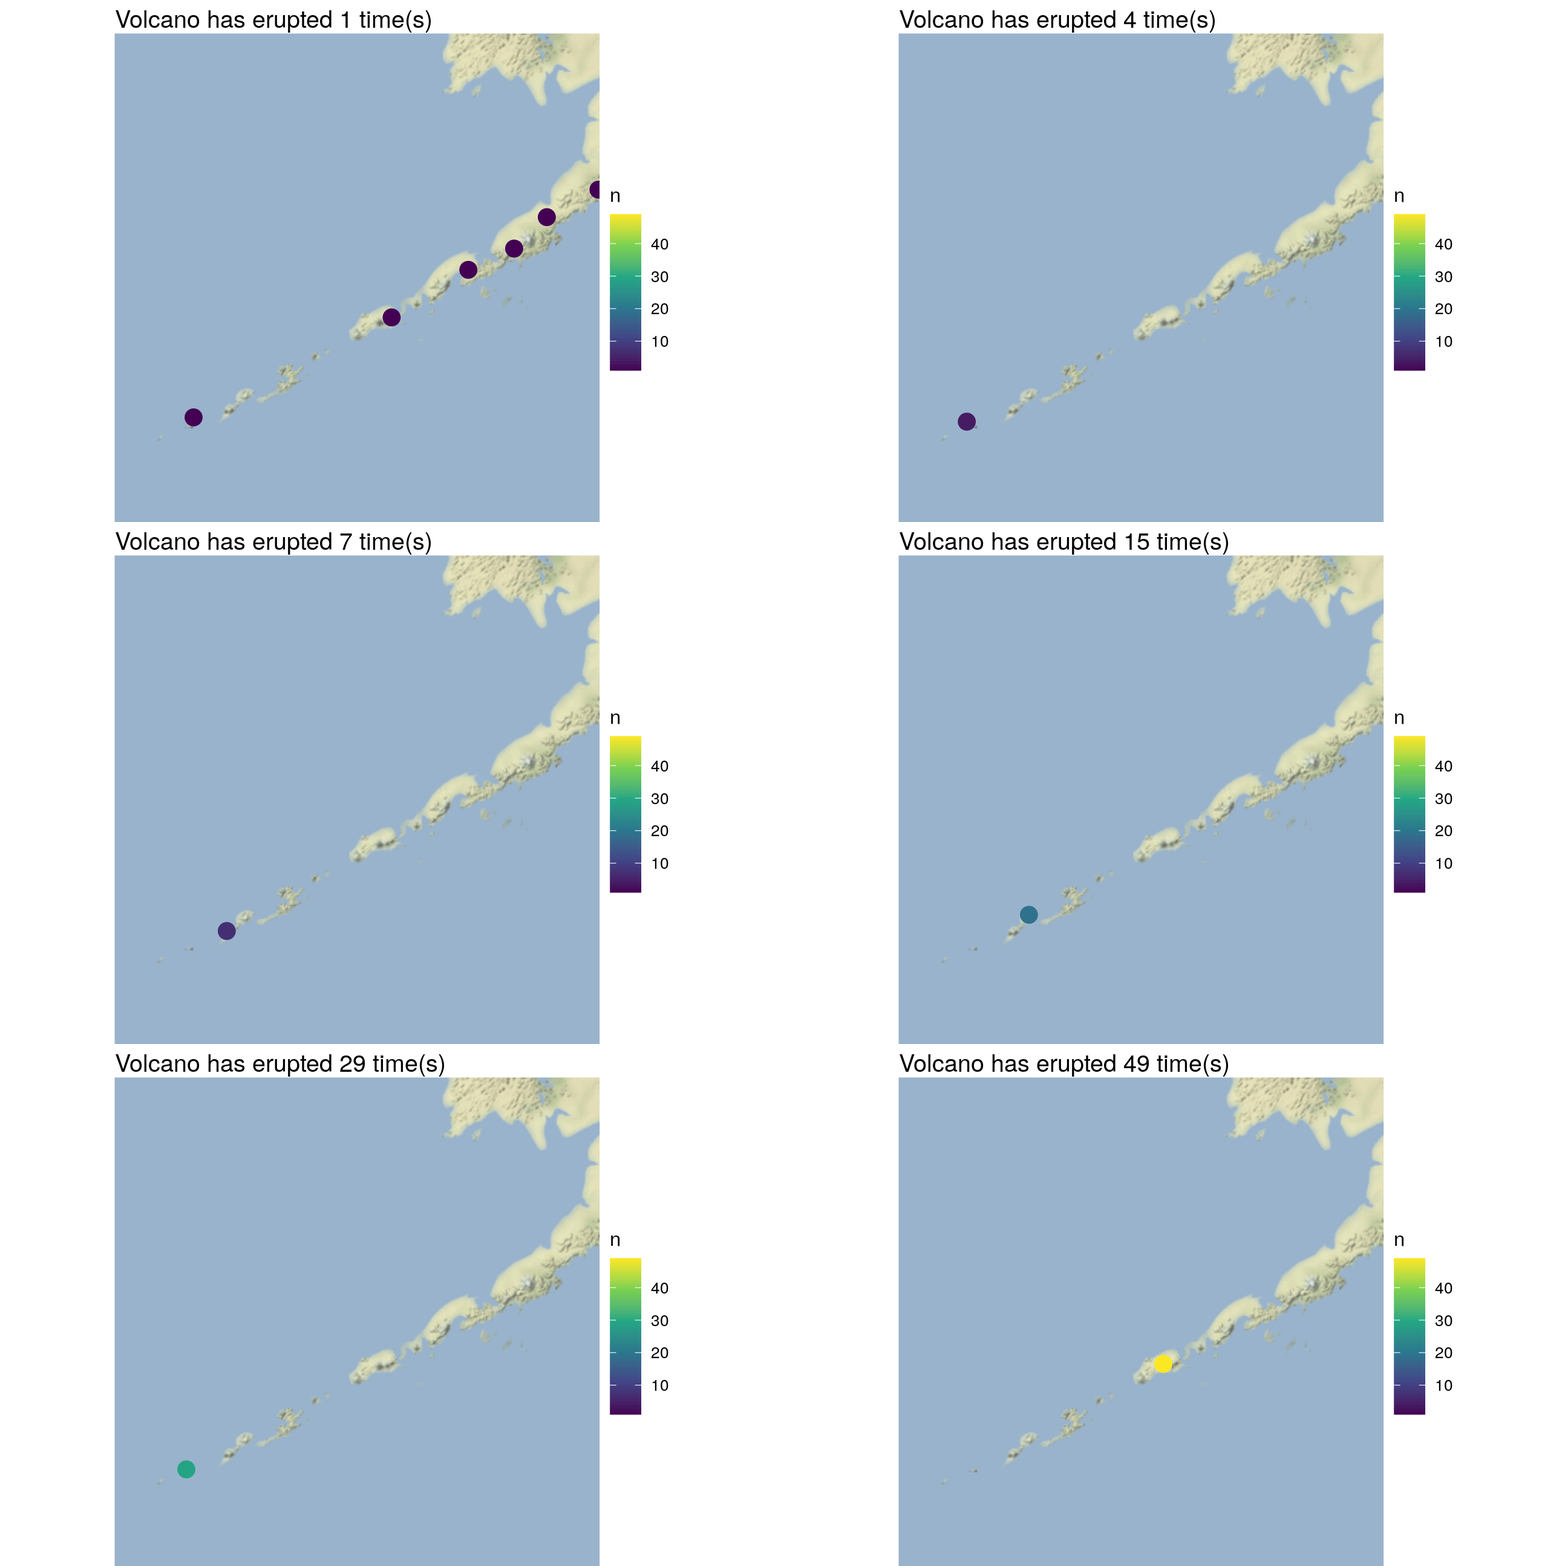<!-- --> --- ```r p_animate <- p + transition_reveal(year) + labs(title = "The Year is {round(frame_along, 0)}.") p_animate ``` 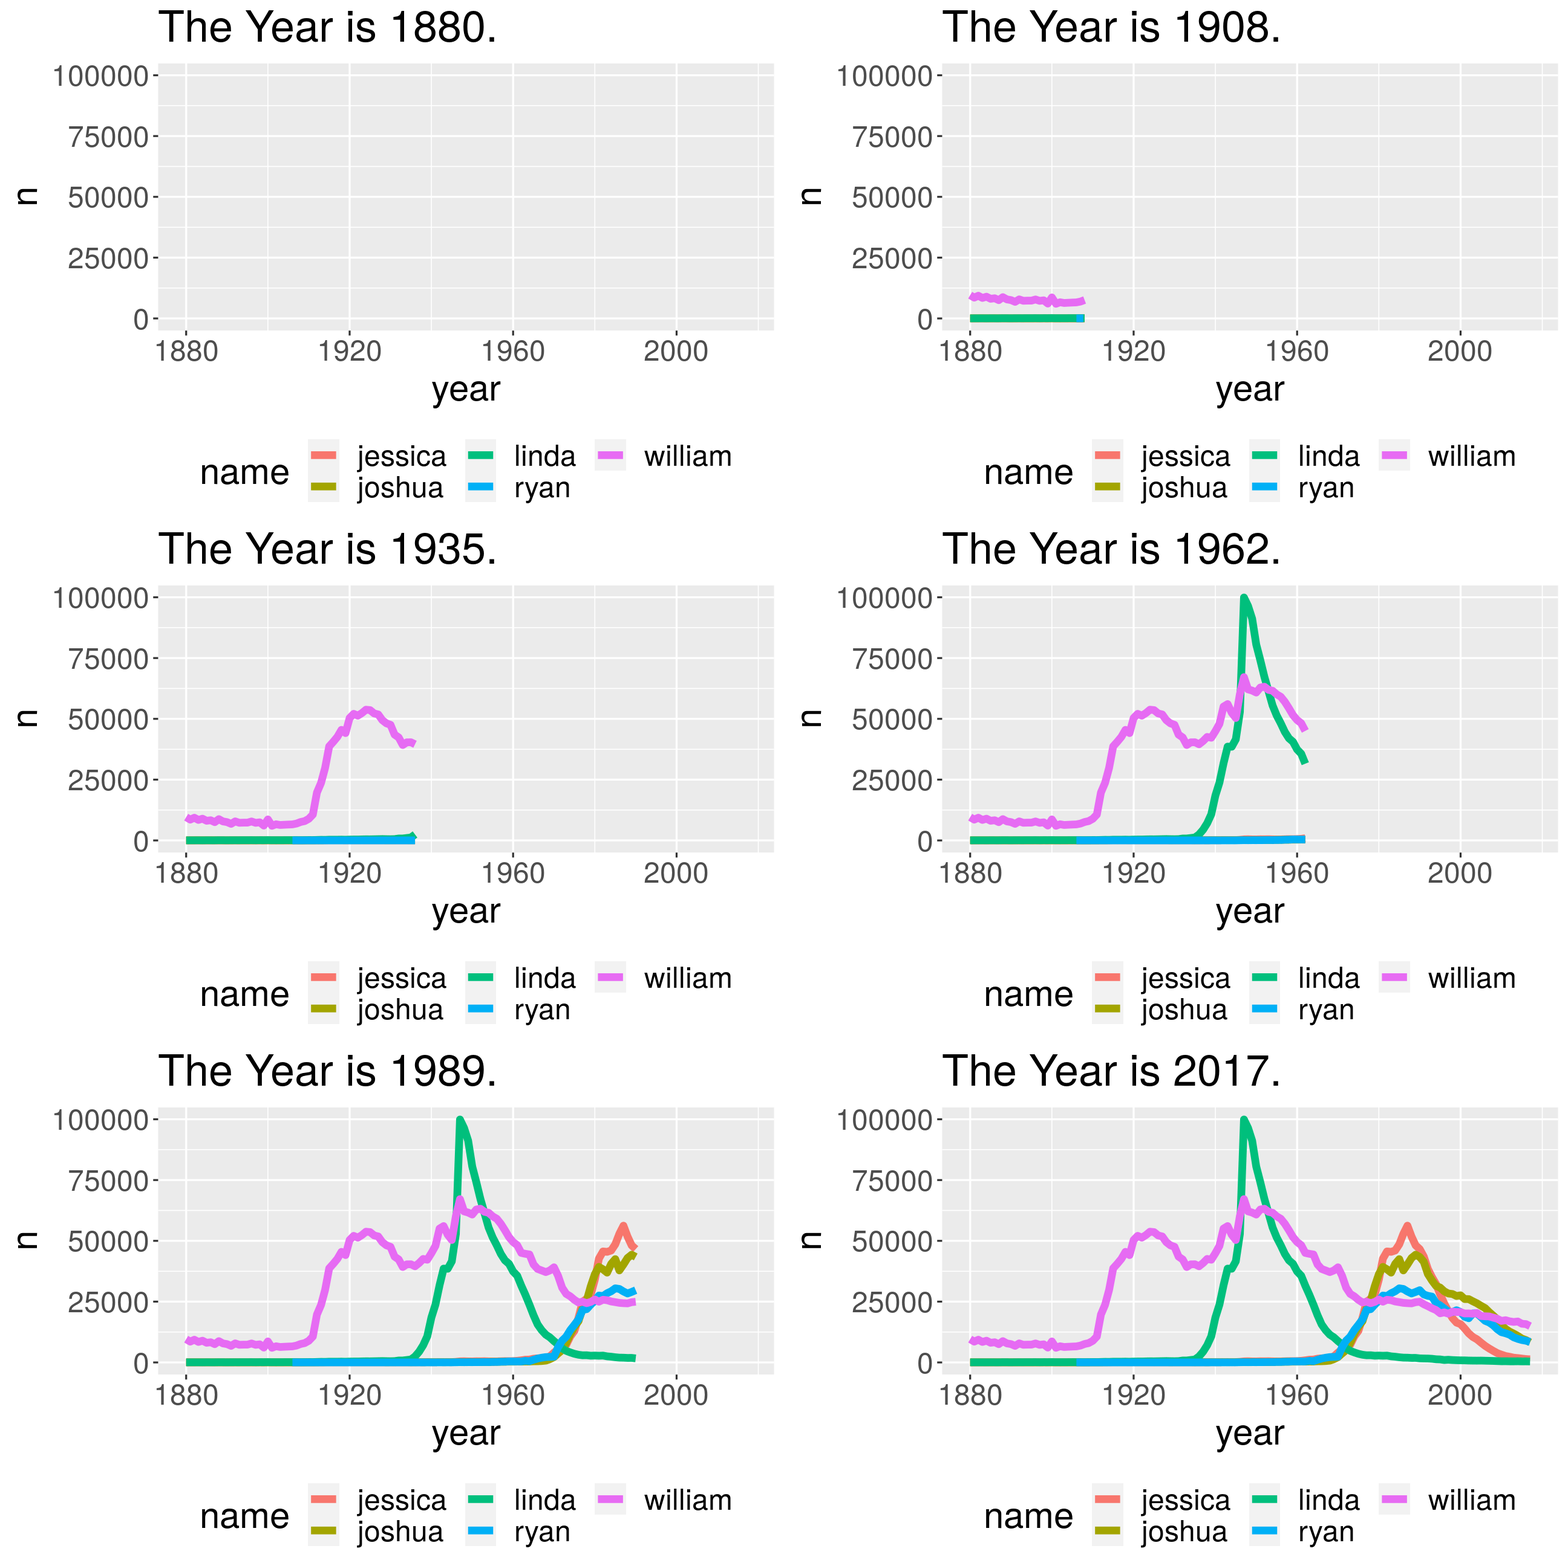<!-- --> --- * Can modify how data enters and exits. ```r p_aleutian + enter_grow() + exit_shrink() ``` 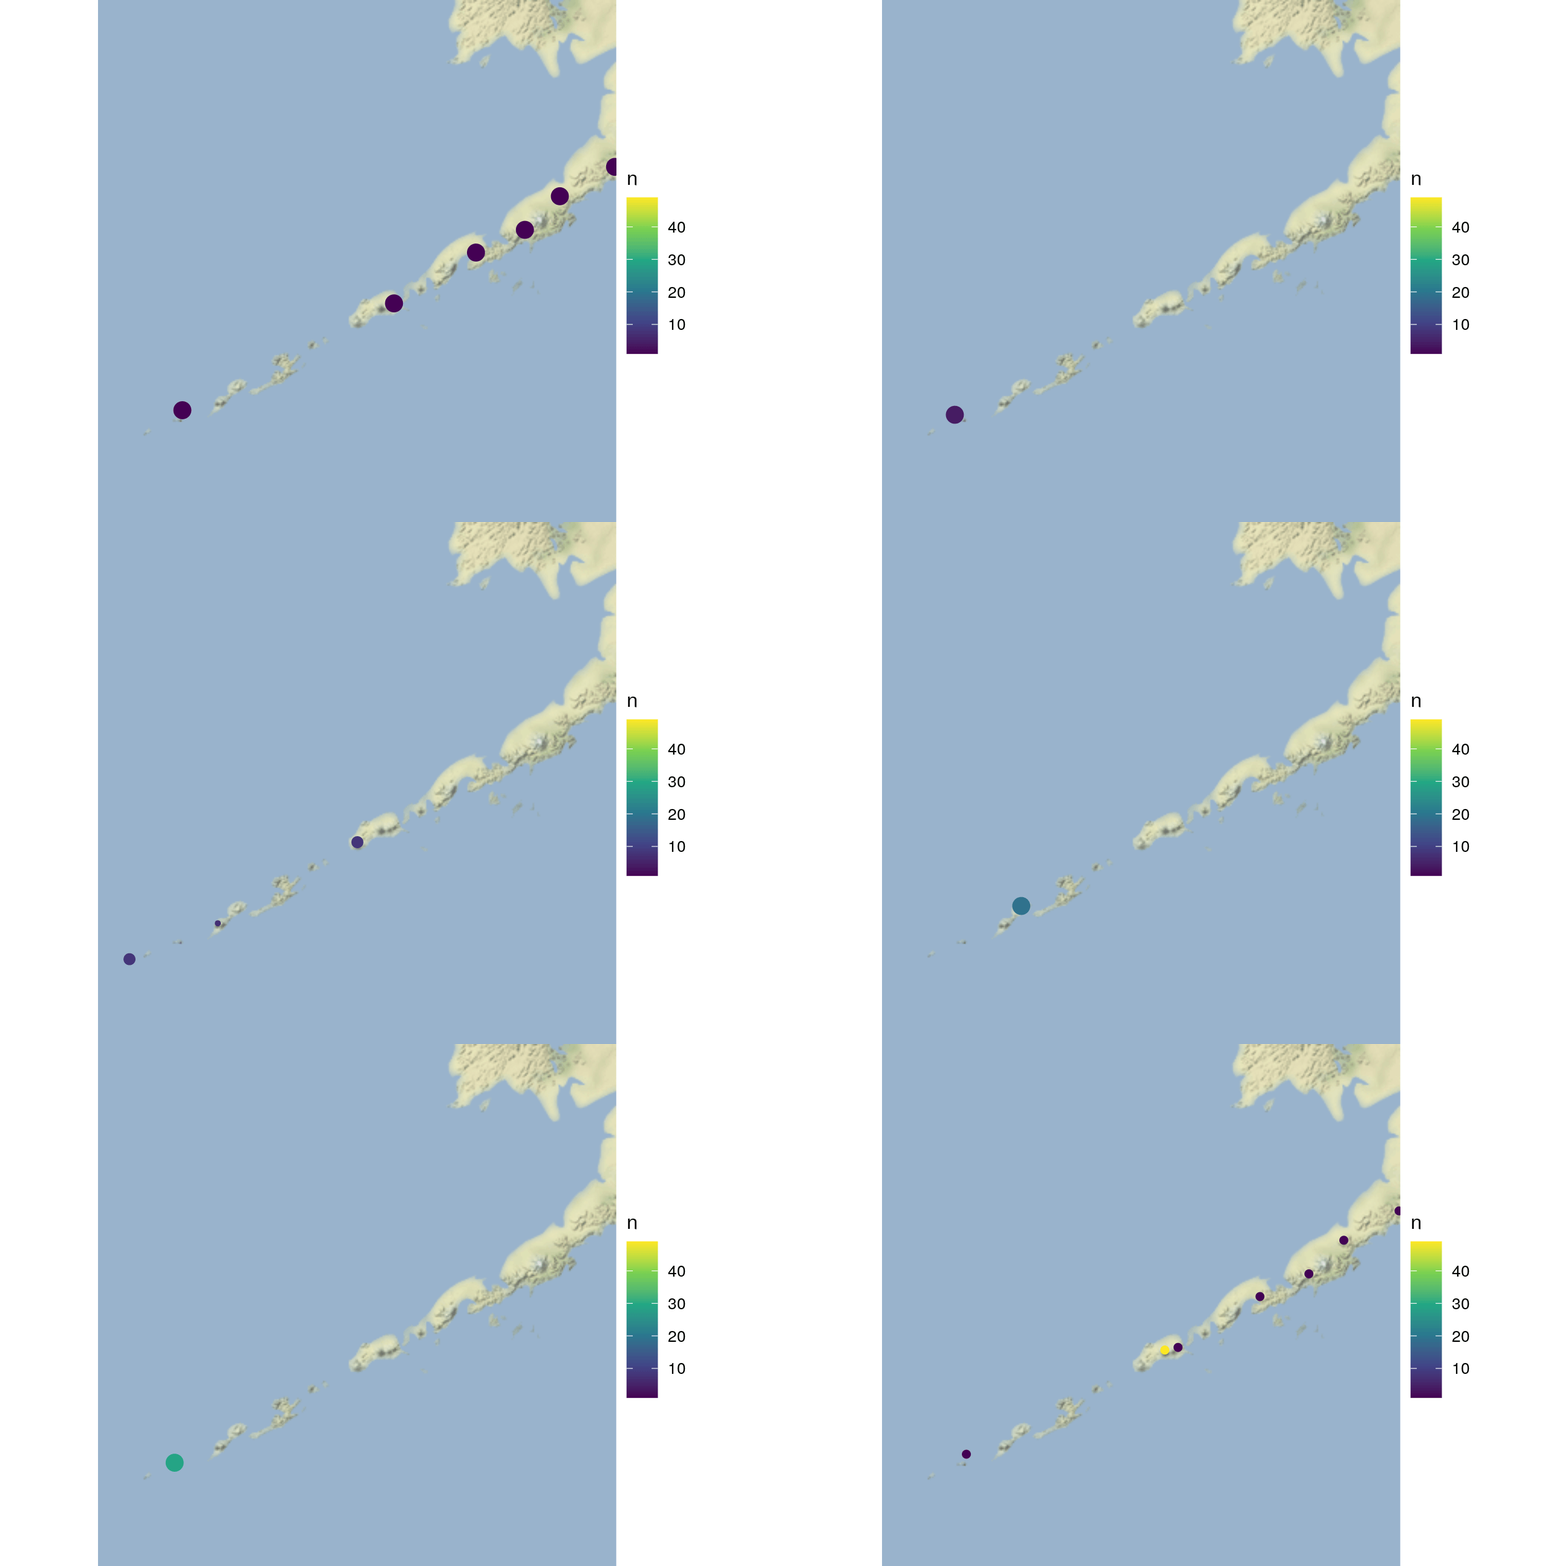<!-- --> --- * Can change the rate between transitions. ```r p_aleutian + ease_aes("cubic-in") ``` 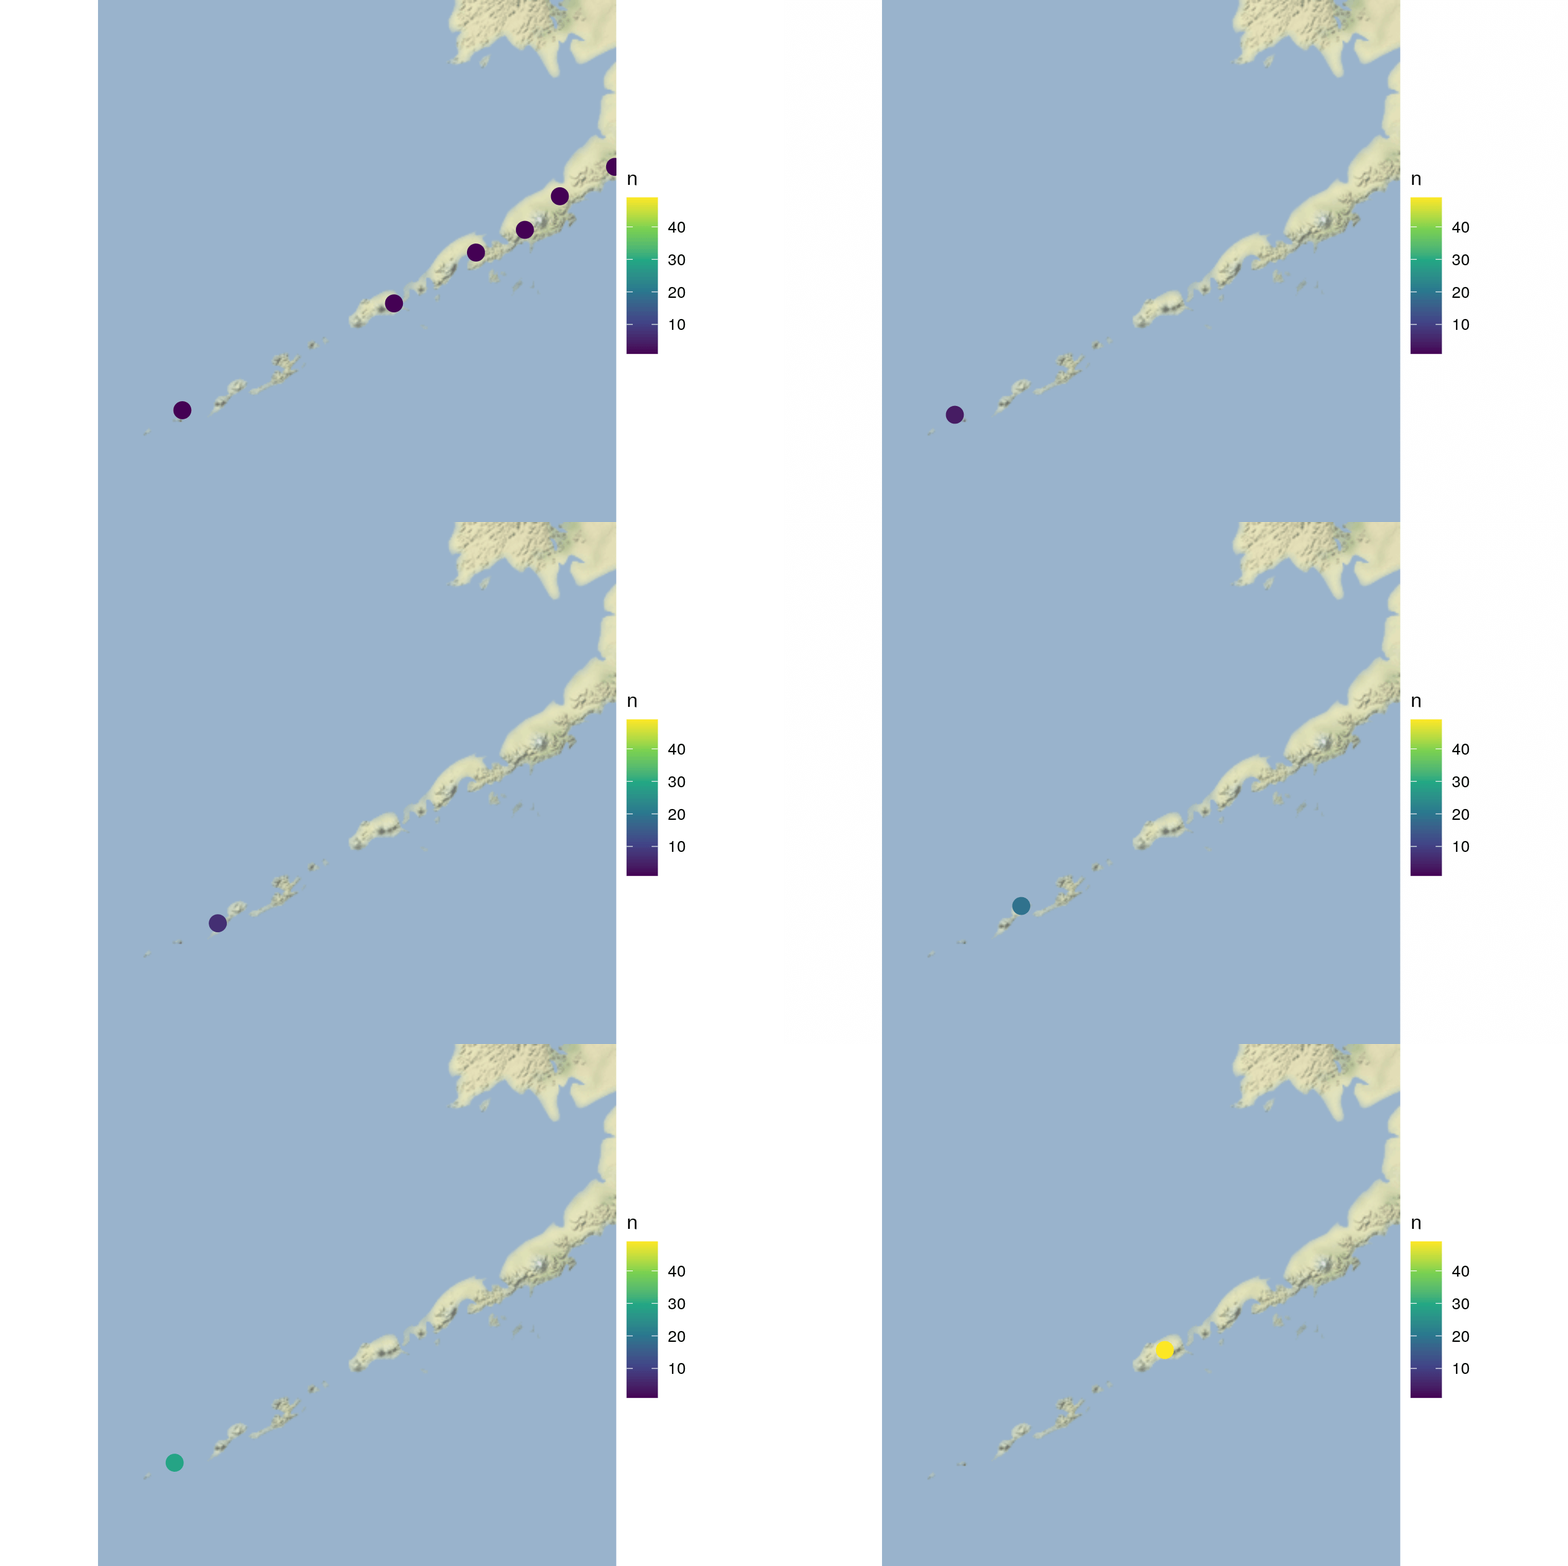<!-- --> --- ```r ggplot(data = baby_math241_years, mapping = aes(x = year, y = n)) + geom_point(aes(color = name), size = 3) + theme(legend.position = "bottom", text = element_text(size=20)) + transition_time(year) + view_follow() ``` --- ## Animate Previous Graphs ```r library(genius) hey_jude <- genius_lyrics(artist = "The Beatles", song = "Hey Jude") ``` ```r library(tidytext) p_jude <- hey_jude %>% unnest_tokens(output = word, input = lyric, token = "words") %>% anti_join(stop_words, by = "word") %>% count(word, sort = TRUE) %>% filter(n > 2) %>% mutate(word = fct_reorder(word, n)) %>% ggplot(mapping = aes(x = word, y = n)) + geom_col(fill = "#D63447") + coord_flip() ``` --- ## Animate Previous Graphs <img src="slidesWk10Th_files/figure-html/unnamed-chunk-23-1.png" width="432" /> --- * Shadow: Want to add memory ```r p_jude <- p_jude + transition_states(n) p_jude ``` 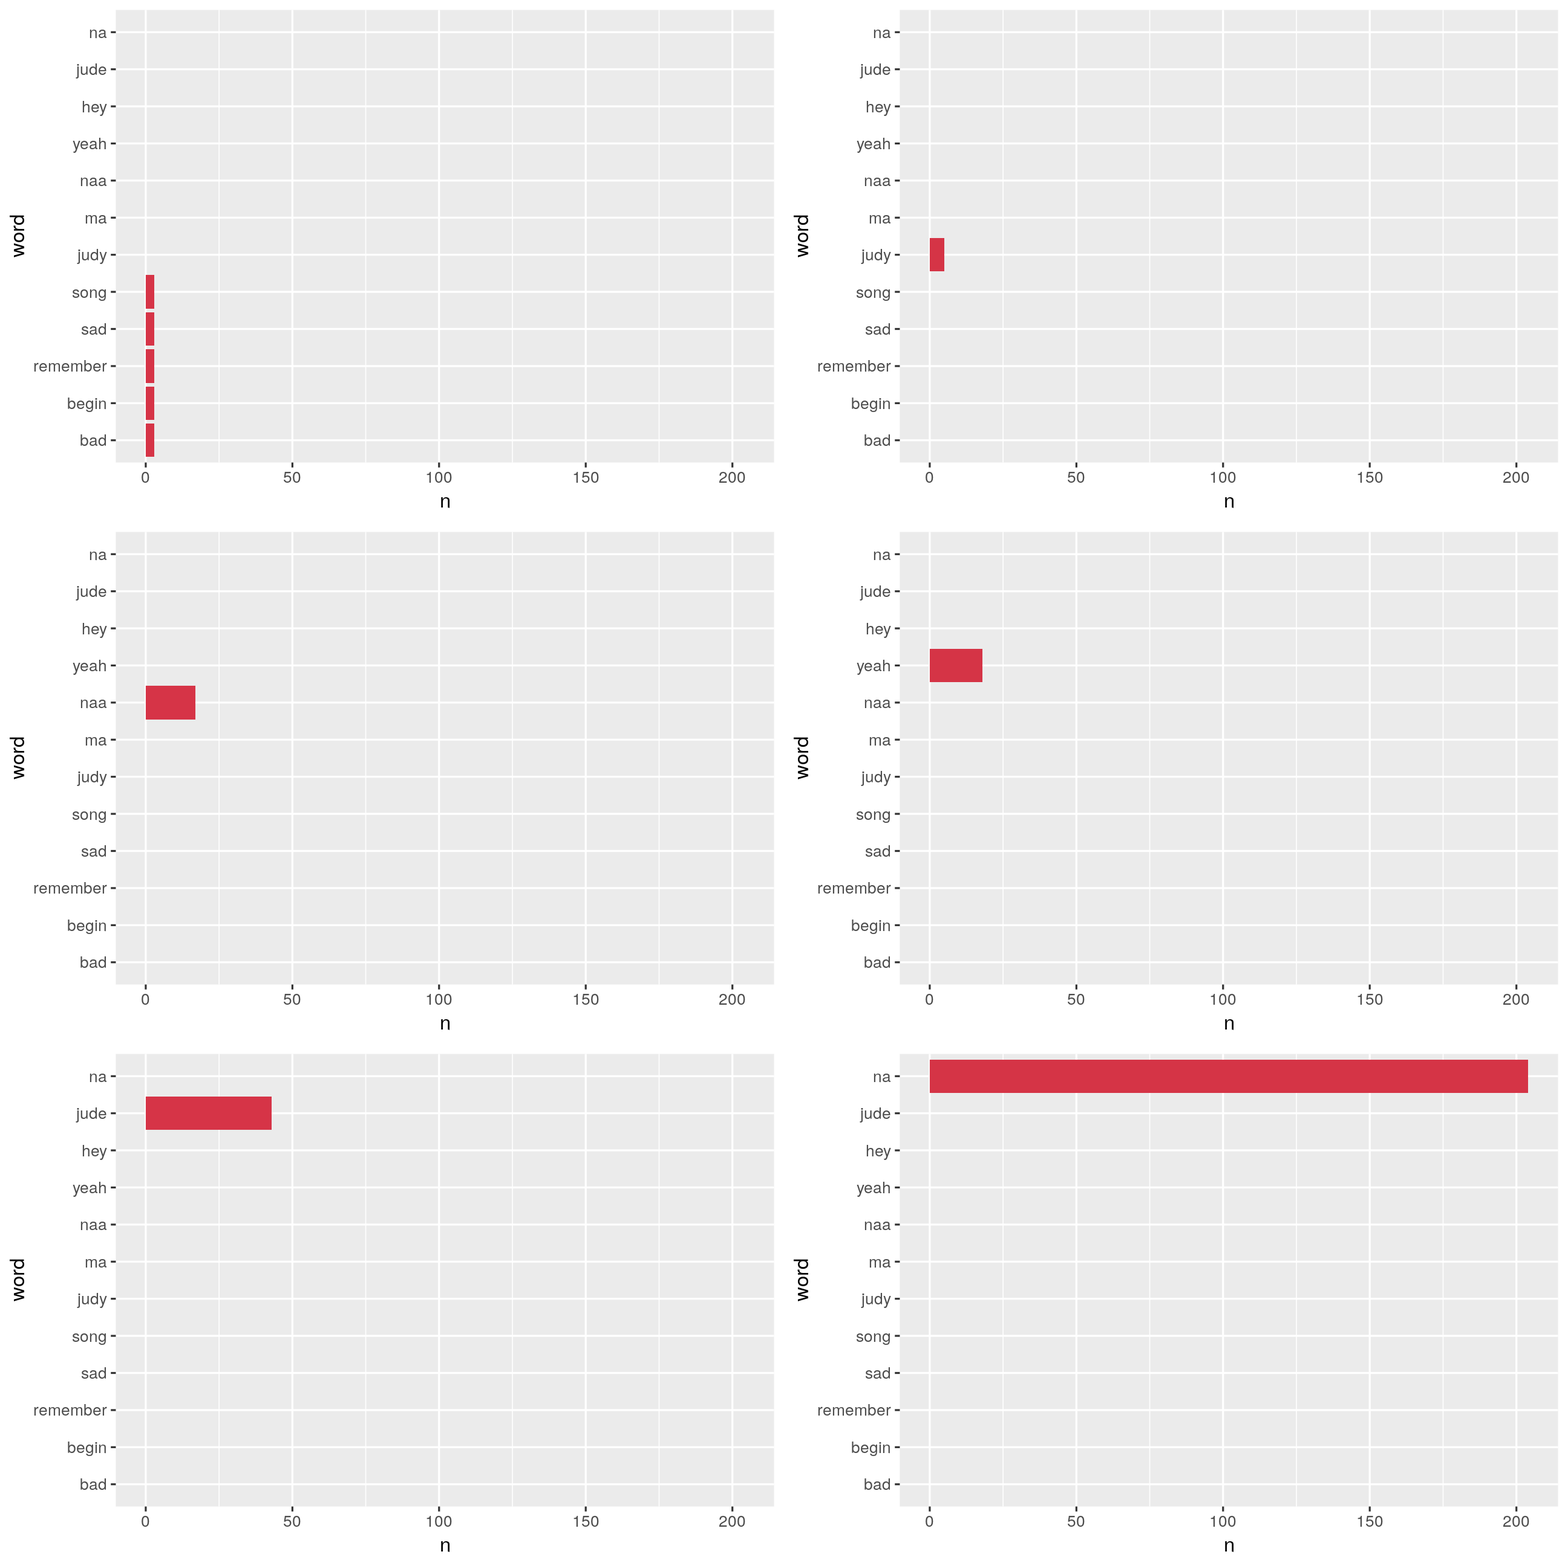<!-- --> --- ```r p_jude + transition_states(n) + shadow_mark() ``` <!-- --> --- ```r p_jude + transition_states(n) + shadow_mark() + enter_grow() ``` <!-- --> --- ## Saving the Animation * Create a gif ```r anim_save("p_jude.gif", p_jude) ``` --- ## Why Add Animation to a Graph? -- * To engage the viewer * To accentuate the story * To add another variable to the plot But don't add animation just because you can. Drawbacks? -- * Require a higher level of attention * Can obscure the story --- ## Interactive Plots * We saw interactivity in maps last time with `leaflet`. + Want to showcase another interactive component: toggling data in and out of graph. * See first step in interactivity in plots with `plotly`. + But that will be fairly limited. + Add in more interactivity next week with `shiny`. --- ## Come Back to `leaflet` ```r library(leaflet) confirmed <- Eruptions %>% filter(EruptionCategory == "Confirmed Eruption") not_confirmed <- Eruptions %>% filter(EruptionCategory != "Confirmed Eruption") p_vol <- leaflet() %>% addTiles() %>% addCircleMarkers(lng = ~Longitude, lat = ~Latitude, radius = 2, stroke = FALSE, data = confirmed, color = "purple", group = "Confirmed") %>% addCircleMarkers(lng = ~Longitude, lat = ~Latitude, radius = 2, stroke = FALSE, data = not_confirmed, color = "red", group = "Not Confirmed") %>% # Layers control addLayersControl( overlayGroups = c("Confirmed", "Not Confirmed"), options = layersControlOptions(collapsed = FALSE)) ``` --- ```r p_vol ``` <div id="htmlwidget-9f269c04d03deb531fac" style="width:432px;height:288px;" class="leaflet html-widget"></div> <script type="application/json" data-for="htmlwidget-9f269c04d03deb531fac">{"x":{"options":{"crs":{"crsClass":"L.CRS.EPSG3857","code":null,"proj4def":null,"projectedBounds":null,"options":{}}},"calls":[{"method":"addTiles","args":["//{s}.tile.openstreetmap.org/{z}/{x}/{y}.png",null,null,{"minZoom":0,"maxZoom":18,"tileSize":256,"subdomains":"abc","errorTileUrl":"","tms":false,"noWrap":false,"zoomOffset":0,"zoomReverse":false,"opacity":1,"zIndex":1,"detectRetina":false,"attribution":"© <a href=\"http://openstreetmap.org\">OpenStreetMap<\/a> contributors, <a href=\"http://creativecommons.org/licenses/by-sa/2.0/\">CC-BY-SA<\/a>"}]},{"method":"addCircleMarkers","args":[[12.77,50.861,10.025,13.434,-36.863,1.112,11.984,37.734,12.422,10.412,-0.381,-7.942,-23.37,-8.42,10.025,-37.856,50.861,-57.787,12.602,32.884,1.358,56.056,-0.677,12.3,0.8,-15.78,-8.508,35.233,36.406,52.825,12.702,30.443,0.02,1.358,12.602,12.77,45.95,4.892,-41.326,-1.467,-16.355,10.025,50.324,-21.244,-8.125,13.434,54.049,1.112,56.056,-20.536,0.8,4.892,-39.42,14.95,55.417,48.875,10.025,-8.542,35.893,10.83,-4.08,32.884,64.63,-15.78,13.257,30.443,-4.271,-37.856,-21.244,2.78,53.589,55.417,-8.2,-1.408,20.42,-6.102,-4.649,-7.542,-7.242,-7.93,2.78,54.756,12.702,-0.381,-9.02,32.884,-8.125,13.434,52.825,27.247,-7.542,53.589,12.278,-6.77,15.05,3.17,37.734,-8.53,56.056,-39.42,-5.05,-16.355,56.17,48.98,12.702,30.789,10.025,55.417,13.257,-23.37,14.381,-6.77,12.278,45.012,15.406,-4.649,-4.271,19.514,12.702,-37.856,-5.525,55.832,-39.157,46.525,-5.05,18.13,-8.32,50.861,-0.381,1.358,0.8,12.702,-53.106,56.056,45.012,1.112,-37.52,-39.157,-25.887,-31.08,-57.787,2.78,1.22,-8.508,-5.05,-5.576,-0.381,4.892,10.83,51.923,24.751,-4.649,10.025,-8.272,15.05,0.8,-1.408,-45.9,27.73,-14.27,12.702,10.83,-0.381,-6.102,52.825,1.112,-2.764,13.37,-15.4,-40.59,64.42,32.884,12.602,18.13,45.95,56.056,-4.271,2.78,1.358,-35.223,31.934,10.025,14.242,-7.942,-1.467,-57.787,55.131,12.77,-7.542,-6.102,-21.244,12.278,-35.223,3.17,37.734,1.22,-4.08,2.78,-4.271,50.686,48.958,12.702,52.559,52.825,16.58,-5.05,55.972,18.13,34.094,37.734,31.934,63.63,24.285,30.479,10.025,-1.408,-1.467,55.972,11.538,-39.42,31.934,-21.244,10.2,52.825,-14.27,-7.2,13.257,12.702,-5.525,56.056,12.17,52.825,48.092,-8.42,-7.242,-0.37,34.094,-1.697,-6.102,-20.536,60.485,50.686,-39.42,36.406,-7.2,10.2,52.825,-4.03,53.321,2.78,12.702,43.384,13.793,-15.37,-15.1,2.93,-39.42,-57.787,1.22,56.056,-21.244,-10.38,31.934,13.257,36.406,52.177,11.538,50.324,-0.077,-5.416,53.43,55.972,12.602,12.702,-8.125,1.112,-0.92,-16.25,12.278,37.734,34.094,-42.833,11.984,-8.676,1.488,-1.697,-5.416,56.17,32.884,-25.887,10.2,-57.787,34.094,2.93,-38.692,-35.745,-0.978,16.35,11.538,12.702,12.602,-6.102,1.22,-7.93,15.55,-39.28,-1.697,-5.576,50.324,55.417,12.17,-8.125,1.38,52.825,1.112,-2.764,-38.692,-5.519,55.972,-5.05,-16.507,-9.02,35.893,37.734,-0.978,-0.077,50.324,2.93,56.056,11.538,-7.792,-11.75,1.112,-25.887,12.602,18.13,-1.408,52.381,-16.25,-5.519,12.77,-39.28,-4.03,10.2,58.77,-0.978,11.538,34.094,-4.271,-5.525,-18.992,12.602,11.984,-21.244,37.734,13.257,2.78,-57.787,10.412,-11.75,-23.37,55.972,-16.355,10.2,43.384,12.77,16.35,-29.27,-53.106,56.17,-5.05,-7.542,13.257,34.094,52.825,-10.38,1.112,0.75,37.734,59.363,55.972,-15.4,-11.75,1.22,12.702,-16.507,-0.83,-5.416,-21.244,-57.787,12.595,56.17,13.257,9.83,11.538,-53.03,24.285,13.853,12.278,-0.37,-23.37,-5.525,1.112,-11.75,16.72,32.884,-0.978,34.094,-5.05,52.825,50.324,11.984,-25.887,52.381,-21.244,-8.676,-16.507,50.686,-4.271,10.412,56.056,19.023,56.17,12.702,34.094,-5.525,-0.077,12.602,64.42,-4.08,29.638,1.112,-8.42,46.2,56.056,37.734,36.406,-16.507,-0.381,-39.42,-37.42,48.98,14.381,1.22,52.381,-8.676,-46.9,-1.697,-7.942,13.257,3.67,19.023,-1.408,-21.244,1.488,-5.05,16.35,2.78,12.602,-19.75,-9.02,30.789,16.72,43.418,54.756,56.17,-16.68,37.734,-8.676,-5.525,32.884,55.972,-4.08,11.984,1.358,-36.863,0.8,-15.78,55.972,32.884,-7.2,-8.365,12.702,-53.106,-16.507,-21.244,-8.542,-39.42,-4.08,16.35,-57.787,10.73,50.324,-5.05,-25.887,-38.692,-14.215,13.257,37.734,10.412,36.406,30.789,14.601,55.972,1.358,10.412,56.056,-21.244,-7.32,-0.077,-25.887,-4.08,37.734,-23.37,12.602,-38.692,-8.542,13.257,-0.171,-4.271,2.3,56.17,-5.05,30.484,-5.576,62.006,-1.408,52.381,-57.787,1.22,-8.125,14.381,12.702,-5.525,-25.887,-1.52,30.789,56.056,-10.38,-0.171,-16.68,1.358,50.324,-1.52,13.434,-4.08,-21.244,14.473,55.972,12.3,37.734,-0.171,-32.958,54.049,14.381,53.256,-58.42,-18.325,-0.978,24.751,-57.787,-5.05,55.972,-6.102,37.734,-4.08,-21.244,-16.507,1.488,-1.697,12.702,-53.03,20.42,11.984,-0.381,-21.244,-37.52,-1.408,52.825,12.602,-5.05,-8.73,34.094,13.257,4.914,29.638,-7.942,-10.38,30.789,-5.05,42.063,-3.52,14.381,-57.787,56.056,-23.37,55.972,13.257,-8.125,-37.856,52.449,34.094,-21.244,-4.08,-6.102,4.203,1.112,1.358,-15.78,42.544,1.22,52.449,55.972,-0.381,-53.106,-37.52,-6.137,63.98,29.638,-21.244,56.056,-1.408,30.789,11.538,11.984,-9.02,-5.05,45.389,-1.467,24.751,56.653,12.506,-8.125,-21.244,-8.058,13.257,29.638,-25.887,-8.53,14.473,12.602,62.006,-7.242,12.702,-10.38,85.608,56.653,-0.381,-8.542,4.203,-8.242,54.756,4.914,-1.697,2.78,55.972,56.056,-6.102,-16.68,-9.02,-20.85,29.638,1.488,64.42,38.73,-35.223,-38.692,43.384,54.756,-1.697,42.063,-1.408,-0.92,11.984,-37.52,57.135,-0.171,56.056,2.78,-1.697,-8.242,-16.507,55.972,56.653,52.381,30.789,4.914,-38.692,36.921,-37.52,-21.244,-39.42,10.83,45.95,13.434,-25.887,55.972,19.514,36.921,-39.28,56.056,39.964,15.307,11.984,54.756,12.702,39.964,55.972,52.825,-57.787,-25.887,-8.125,56.653,52.5,-6.102,-0.171,-38.692,53.43,-9.02,-8.2,30.789,-7.2,29.638,11.984,50.861,-1.408,-53.03,43.384,56.056,-23.37,2.78,-57.787,64.42,-25.887,52.5,-39.42,55.417,37.647,10.412,-1.697,55.972,-6.102,-39.28,-16.25,10.2,19.023,42.063,42.67,18.92,-20.98,32.761,54.049,53.98,-39.42,18.13,0.792,0.8,54.756,-37.721,-4.271,-25.887,56.17,2.78,10.83,-38.692,15.62,33.086,-57.787,-7.942,-20.73,-37.856,55.972,16.72,-37.52,51.923,-19.18,12.506,56.17,-39.42,14.95,-57.787,-7.942,-15.4,-8.125,36.227,53.891,-0.37,13.434,-39.28,-14.215,-10.38,19.023,12.278,9.979,-37.856,-16.25,12.77,-23.37,52.825,-4.03,-39.42,-4.271,-2.764,56.056,24.751,-8.242,12.602,19.514,-23.37,-8.125,55.972,-1.408,-1.52,37.734,-8.42,52.825,-38.692,32.884,-5.05,-6.102,10.2,-8.058,51.923,0.8,-23.37,-0.43,-5.358,55.972,-8.53,54.756,10.412,37.734,53.891,56.17,-8.058,46.52,11.984,-8.342,52.315,0.8,-8.125,-0.171,37.734,13.257,15.13,-23.37,18.78,-7.2,18.13,1.22,-5.05,-53.106,52.315,54.134,-53.03,24.285,-6.102,10.2,56.056,-39.42,-21.244,-38.692,-37.856,15.13,53.93,61.299,10.412,-53.106,32.884,18.13,12.506,3.67,55.972,54.134,-39.28,10.2,56.056,-7.542,10.412,37.734,31.934,9.83,54.518,-8.342,-23.37,0.33,-1.408,54.134,-8.125,-39.42,-45.9,-21.244,-11.75,-39.28,2.78,-19.18,1.112,1.358,35.893,-8.542,-8.342,10.83,-9.02,-0.37,56.056,15.13,12.278,10.2,19.514,9.83,-8.62,10.412,-35.223,63.98,53.256,50.686,4.914,-1.697,-23.37,32.761,46.2,34.724,54.134,-16.25,36.406,-39.28,52.103,-25.887,-15.78,0.8,-0.171,29.638,12.3,55.417,-38.692,-7.93,55.972,-8.542,54.134,-21.244,-8.125,56.653,-39.28,1.22,14.381,-17.436,-40.59,37.734,60.485,46.2,10.412,20.13,37.734,51.79,55.972,-10.38,34.9,-39.28,2.78,4.203,45.012,-1.408,-16.25,1.112,36.921,56.653,32.884,54.134,11.984,1.22,50.686,48.092,-5.05,12.3,-38.377,43.418,-39.28,56.653,-49.358,37.734,-0.37,-25.887,18.13,0.32,-7.242,-15.78,10.412,-20.536,11.538,32.884,-4.523,1.358,54.134,-39.28,12.77,-6.102,0.8,-16.25,30.789,43.384,29.638,9.83,-1.408,-8.62,-33.425,34.724,-23.37,12.602,50.686,-8.342,18.13,52.5,51.79,-39.28,24.285,19.514,52.825,-28.98,10.2,-8.125,36.921,51.93,1.38,10.83,10.412,56.17,56.011,37.734,52.381,53.891,11.984,54.134,-0.381,14.473,10.83,55.972,-15.78,56.056,53.43,50.324,34.724,-16.25,37.734,48.98,-7.542,-23.37,48.092,-7.2,44.83,-1.408,0.686,-9.02,-35.745,56.056,10.412,-25.887,-8.342,50.861,-28.98,52.825,55.417,56.653,59.363,55.972,1.358,54.756,54.134,37.734,-39.28,-37.52,15.132,-33.425,24.285,46.52,4.914,37.734,-9.02,11.538,-5.05,-39.28,13.434,10.412,4.892,29.638,10.83,-8.125,56.056,-8.2,43.418,-21.244,55.972,56.653,-39.28,1.112,-0.171,-15.6,10.412,37.734,-8.32,-53.106,-17.564,71.087,-16.294,19.514,-5.05,4.892,11.538,-23.37,56.17,-0.381,-39.28,29.638,13.257,65.73,-5.05,-39.42,52.559,37.734,52.825,-10.38,1.112,-7.942,-8.32,43.384,37.734,-38.692,32.884,-39.28,10.83,-0.37,19.475,56.653,56.056,26.06,-18.992,-1.408,55.972,-7.25,-16.25,-37.52,-7.942,-17.564,-21.244,55.417,-5.05,-28.98,-39.42,34.094,-6.77,-8.53,0.8,36.618,-0.162,-17.564,55.417,53.43,32.884,12.77,56.17,64.42,-8.342,2.78,36.921,36.406,37.734,11.538,-28.98,10.83,19.421,-2.764,-16.25,-0.381,-0.381,24.751,46.525,-8.342,36.618,-16.507,4.203,56.056,54.134,36.406,19.421,0.02,1.112,-8.125,-1.52,-25.887,19.421,36.406,-14.27,-9.02,-7.25,50.861,17.36,56.056,-17.564,-0.381,24.751,-28.98,51.79,11.538,44.83,2.78,-1.408,37.734,50.861,12.602,65.73,-39.28,55.417,-0.171,-0.37,-14.27,32.884,55.972,44.353,18.13,-38.12,50.861,-6.102,12.77,63.98,55.417,53.43,37.734,1.38,10.2,42.688,-16.25,-21.244,12.602,65.73,37.734,56.056,-7.2,10.2,-28.98,55.417,-8.32,-39.28,-9.02,-5.05,-37.92,30.443,32.884,10.2,0.8,-46.9,56.653,55.972,63.98,10.412,51.79,37.734,55.417,54.134,-39.42,52.559,-7.942,48.958,-16.25,53.891,55.972,-16.507,-0.381,46.2,2.78,65.73,-6.102,24.751,19.421,-28.98,-1.408,-39.28,-33.425,-25.887,-14.27,12.77,19.421,-0.83,35.893,-38.692,-28.98,55.972,10.2,37.734,-6.102,37.734,-16.507,-39.28,-16.25,32.884,2.78,-21.244,-15.62,-19.18,-40.35,13.33,48.98,-47.2,-49.02,-7.2,31.934,55.972,54.756,-25.887,-0.92,-16.25,-4.649,-16.68,4.914,42.688,24.751,-16.507,11.58,54.134,10.2,55.972,-0.37,12.77,44.353,-6.102,10.412,-9.02,-49.02,42.688,-5.05,37.734,11.538,13.257,-38.12,2.78,54.756,54.518,-25.887,19.077,-8.125,10.2,-28.98,37.735,19.514,1.352,12.3,-21.244,-25.887,12.702,14.002,19.421,14.473,42.544,56.056,-16.25,-9.02,-39.28,-39.157,-8.125,10.2,65.73,-14.27,32.884,-11.75,11.538,-25.887,57.832,55.972,-21.244,-0.37,2.32,52.315,14.473,9.979,-9.02,-39.42,-16.25,12.3,-1.52,-1.408,-37.52,13.434,12.602,-21.244,54.134,48.092,2.78,-39.28,14.002,12.702,-9.02,-39.157,16.044,10.2,-8.125,-16.507,30.443,55.972,12.702,-39.28,36.618,59.363,-14.27,-0.077,-5.358,54.756,24.751,45.95,65.73,19.514,19.421,-21.244,1.358,-39.28,30.484,32.884,54.756,55.417,23.5,-9.02,19.475,55.832,14.473,12.602,-39.28,-6.102,-16.507,-8.125,37.734,-39.157,-0.381,-59.458,19.421,-4.649,24.285,-9.02,-5.519,14.473,37.734,19.421,10.2,-37.52,12.3,55.417,36.921,19.421,58.236,-8.125,30.443,56.056,55.417,-8.242,-4.08,39.099,34.724,-4.03,52.076,-4.649,54.134,-16.829,37.734,-16.507,1.22,11.538,24.285,-0.37,-8.53,55.417,19.421,30.443,-0.077,-39.28,-8.32,-35.745,-14.27,-5.05,21.93,1.358,52.381,50.324,-7.242,46.042,-0.381,44.353,-15.62,-14.215,-36.863,45.012,-21.244,19.421,-8.125,-16.25,27.247,-5.358,-8.342,54.134,-5.525,14.473,-38.12,36.406,-4.03,63.43,71.087,1.112,32.884,45.012,-8.242,-77.53,-39.157,14.501,-9.02,-39.28,-8.32,-5.519,-7.542,-11.75,30.443,-41.326,12.3,-17.662,-0.077,0.792,50.861,-6.102,-21.244,-0.37,46.47,-16.25,-39.157,10.2,-7.942,-8.242,-3.03,-77.53,2.78,-6.137,-49.02,-38.692,56.056,-7.3,-39.42,28.57,59.363,13.33,19.421,37.734,14.473,-8.125,-10.38,-17.662,19.421,-45.9,31.934,-37.52,57.135,56.056,1.112,-14.27,1.358,12.702,-37.52,37.734,34.724,-39.28,-1.408,-8.242,55.972,-16.829,-16.25,12.506,-5.525,-8.542,2.78,14.002,39.761,71.087,-39.28,55.832,10.83,-63.001,-0.381,10.2,-37.52,34.724,-18.325,10.412,56.056,-6.137,-5.525,54.049,-16.507,63.98,32.884,13.434,1.112,46.042,31.888,34.724,-5.05,-8.242,55.832,45.012,-35.745,0.686,-8.542,-8.508,12.506,24.751,1.358,14.002,-9.02,10.412,-5.525,-14.27,10.83,52.103,56.056,62.006,-37.52,-6.77,-7.242,-39.28,-16.355,19.421,-23.37,10.2,10.83,-18.325,19.077,20.13,-8.82,19.421,-63.001,12.602,50.686,-8.897,-39.157,34.724,24.751,-1.697,30.443,-8.542,58.236,12.506,19.421,-0.978,21.93,19.421,-39.157,-6.137,10.463,34.724,27.881,56.056,1.112,-0.37,-8.77,64.65,-0.37,-6.73,13.257,-39.28,-5.358,-1.697,45.012,14.002,-37.52,-8.242,34.724,-0.978,37.734,-14.27,55.832,10.2,-33.425,24.751,-19.18,-7.93,60.485,-63.001,2.78,27.881,19.421,-1.697,54.049,-0.978,55.832,50.324,58.236,-8.108,14.002,-35.653,-39.28,-2.764,-14.27,-16.25,-6.77,-28.98,-7.242,32.884,34.724,-1.408,14.473,-0.381,20.538,55.832,-7.93,54.756,-16.507,-5.05,-5.525,-7.542,13.434,10.2,50.686,56.056,-8.25,13.6,30.443,-37.52,10.83,13.813,60.485,1.358,3.67,14.473,14.002,13.434,43.384,-1.697,12.602,1.112,12.3,-8.242,-7.93,15.62,55.832,-39.28,-8.42,-6.137,-9.02,-21.244,55.417,-17.662,-0.381,-8.2,13.434,14.473,60.485,37.734,-14.27,-7.242,58.236,19.421,-9.02,48.092,34.724,-10.38,30.484,-8.508,12.3,11.984,-6.77,14.002,-14.27,-8.42,-8.242,-13.8,50.686,56.056,-11.75,1.358,14.381,13.434,36.406,43.384,54.049,-8.508,2.78,55.972,19.421,-6.77,12.602,-17.436,55.832,-6.102,-4.08,55.972,10.2,-21.244,-7.2,-5.525,-29.27,56.653,13.434,32.884,-33.425,-1.697,55.972,43.384,58.236,32.884,-21.244,-6.137,52.103,54.518,-39.42,55.832,-6.73,-4.03,-8.508,50.324,-16.25,-8.2,-8.27,-38.692,-8.32,54.756,1.358,-9.02,-4.08,37.125,56.056,32.884,63.43,-21.244,-77.53,58.236,59.363,19.421,14.473,-14.27,-25.78,-8.242,-16.25,19.421,36.921,-16.507,-1.697,10.2,11.538,55.972,32.884,-0.83,58.236,-5.05,9.979,50.686,0.02,12.506,-39.42,-8.342,36.921,52.5,-4.08,-35.745,-0.978,19.514,0.8,-37.52,19.421,54.134,55.972,34.094,14.473,55.832,-16.507,-14.27,43.418,36.227,58.236,11.538,-39.157,43.384,-4.08,1.358,12.506,36.921,-56.014,-5.525,-6.137,2.78,52.103,34.724,-9.02,12.602,-35.223,65.03,12.506,55.972,-37.092,2.78,-49.02,19.421,36.406,-16.25,43.418,-6.137,-6.77,19.421,-4.08,58.236,55.972,1.358,-33.425,50.324,-7.542,-21.244,-9.02,55.972,55.832,-0.37,14.381,19.421,2.78,19.421,-41.326,52.559,19.514,-37.856,-39.42,-5.525,-21.88,-18.42,-7.242,56.056,52.449,46.525,53.43,37.125,12.506,47.35,-16.25,43.384,32.884,48.092,-5.05,31.888,-33.425,-35.223,-16.507,-16.68,-1.697,-0.077,-40.59,-3.613,55.972,54.049,-8.508,-2.764,19.421,-21.244,13.6,32.884,55.417,29.638,-33.789,-37.856,-49.02,-37.52,-4.08,-6.102,19.421,-35.223,-23.37,37.734,-33.425,55.972,34.724,-16.829,43.418,21.765,-18.42,32.884,-0.92,27.881,-39.157,-4.08,-39.28,43.384,-3.613,-16.25,-33.425,37.734,-21.244,31.934,4.203,56.056,34.724,31.888,55.832,53.589,-6.137,-33.789,64.65,-19.75,36.618,55.972,-37.52,-9.02,-16.25,-39.42,-39.157,37.734,-0.077,-0.381,-16.829,43.418,36.406,-6.102,-7.242,-3.613,-16.68,-0.37,53.43,-1.408,55.832,1.352,-35.745,-0.381,-21.244,50.324,55.972,56.056,55.417,-5.525,-7.242,34.724,-3.613,43.384,1.358,-2.764,-5.05,55.972,-33.425,10.2,45.389,31.888,-8.2,-1.408,-37.52,46.925,-3.613,32.884,47.77,38.6,12.506,-21.244,-16.25,37.734,-1.458,34.724,55.972,-18.02,19.514,31.888,50.324,32.884,24.751,11.538,-6.77,43.384,14.473,-7.242,-9.02,37.734,-6.77,-8.2,39.964,56.056,58.236,-0.83,2.32,53.589,32.884,-4.08,-8.2,53.321,-39.28,-1.408,29.638,16.044,-39.42,55.832,58.236,32.884,-7.2,-11.75,-7.942,43.418,-16.355,-6.77,-5.525,-3.52,43.384,54.049,56.17,-8.125,-39.157,-59.063,32.884,34.724,56.056,-6.137,-22.33,2.32,-7.942,43.384,-7.242,55.972,-38.692,31.593,55.832,-40.35,14.473,32.884,-21.244,54.756,31.888,-5.358,-5.525,37.734,19.421,-5.525,-6.102,-2.764,-8.125,55.832,-37.52,-16.25,-8.2,54.049,48.98,-0.077,-77.53,-7.2,42.688,-0.83,31.888,-8.2,12.495,13.434,-22.33,43.418,-3.613,-0.381,48.092,-2.764,4.203,-23.37,19.421,56.056,32.884,-5.525,-39.157,42.688,-4.08,-8.2,-53.106,-1.408,55.832,12.506,64.42,43.384,-21.244,-16.25,29.638,-39.157,36.406,32.884,55.417,1.112,12.3,37.125,-8.42,34.724,54.756,-6.102,42.688,-8.897,-0.83,-53.106,-7.242,61.299,-2.38,56.056,-6.137,-8.508,-5.358,-16.25,32.884,14.473,-4.08,-7.2,-8.2,-6.102,-21.244,-7.542,58.172,58.236,-16.68,-16.829,-8.125,2.78,54.134,24.417,54.049,-0.43,54.135,-39.157,49.35,50.148,54.049,20.538,12.495,-6.102,-16.829,31.888,43.418,-7.725,-16.25,19.3,1.38,-6.77,-39.28,36.799,19.421,36.406,-21.244,-8.058,-9.02,-3.52,-8.53,10.2,19.077,-6.137,-11.75,2.78,51.79,46.042,-1.697,1.352,53.891,-8.272,-9.02,56.056,-1.408,-8.53,-23.37,-10.38,54.134,55.417,37.734,-21.244,-7.93,-18.02,20.538,42.688,-1.408,-16.355,58.172,45.1,21.93,12.602,1.358,11.538,-7.242,14.95,-38.12,35.52,18.78,32.884,-39.157,54.756,-39.28,-6.892,-7.242,39.964,42.688,-8.95,-8.342,1.38,-0.92,-16.25,-9.02,37.734,12.506,52.076,32.884,-7.725,1.38,-0.381,36.406,-8.53,-21.244,55.417,-8.108,34.724,-6.102,58.236,31.593,-39.28,-39.157,19.475,-7.942,-59.063,-8.342,-3.52,-21.244,37.735,-53.106,38.961,1.22,36.404,39.964,9.83,51.79,52.076,32.884,15.132,37.734,37.734,14.473,-0.381,29.638,-16.829,2.78,1.358,-38.692,39.964,28.57,-8.342,58.236,12.506,2.32,-6.102,56.056,-0.381,-35.653,-8.53,-16.829,36.406,-39.157,36.921,-8.342,19.475,2.3,1.38,-8.42,-22.33,-0.92,-6.137,2.78,-6.77,-7.242,13.813,-39.42,-7.542,-16.829,9.203,-39.157,11.984,-0.83,56.056,31.593,-0.92,12.602,-39.28,-39.157,-8.342,54.134,-11.75,-39.42,32.884,-8.53,12.506,-1.408,-7.942,-21.244,0.02,12.602,11.538,10.2,54.756,39.964,2.78,52.559,-6.77,1.112,12.506,36.406,32.884,2.32,-8.508,54.049,63.98,-3.613,37.734,2.78,-77.53,37.734,13.257,-37.52,55.832,20.538,19.023,14.473,-21.244,-39.42,32.884,-6.102,-4.08,54.134,38.961,-39.28,48.092,10.2,36.406,-8.108,56.056,10.748,-15.6,54.049,54.756,-6.102,-38.692,-21.244,11.984,32.884,46.042,54.049,-39.28,12.602,2.32,31.888,37.734,-8.108,31.593,-36.863,-33.425,30.443,32.884,54.049,54.135,52.449,56.056,-8.108,37.734,53.43,-21.244,-38.692,-39.28,52.076,53.256,-49.02,-41.326,-6.137,-6.102,-8.42,56.056,-7.2,14.473,24.751,38.961,56.653,-39.28,-8.342,42.688,-8.125,42.544,52.825,-7.242,-21.244,11.538,56.17,-0.077,36.406,-3.613,-6.102,-37.856,-38.692,32.884,12.602,-4.271,-7.2,12.3,-7.242,-15.6,-9.57,32.884,53.43,-0.92,-6.137,-21.244,-8.125,4.658,19.85,54.049,20.538,-6.102,-0.381,13.257,-5.358,42.063,-21.244,1.358,-7.32,-39.28,31.593,37.734,-38.692,-16.25,-7.542,19.475,36.618,-6.102,-9.02,19.023,51.923,-8.125,2.78,37.734,-8.108,13.257,-8.82,-38.692,-4.271,31.593,20.538,-6.102,-5.05,36.618,-21.244,10.2,29.638,55.832,-39.157,34.724,-2.764,34.094,-4.03,2.78,12.602,38.144,-7.942,31.593,32.884,36.618,19.475,-4.43,-39.28,-7.242,2.78,-4.271,55.832,53.589,54.049,46.042,13.6,-8.125,-23.37,-0.92,-0.677,-4.03,-8.542,-7.542,-7.242,-3.52,-16.507,56.17,12.602,31.593,-7.2,11.523,55.832,34.724,13.257,36.404,30.484,-39.157,12.3,-4.03,-7.942,36.227,-18.02,56.17,9.979,13.434,52.449,-9.02,-6.75,-7.242,-16.507,-0.677,36.618,34.724,13.813,-6.137,12.602,20.538,65.03,-21.244,-39.42,-38.692,-6.75,52.449,54.049,53.891,0.8,-35.223,-8.125,49.57,34.724,-21.244,36.618,-6.102,13.257,-6.137,-8.77,-8.82,64.42,36.406,29.638,53.256,31.593,-21.88,-6.72,-1.408,-1.697,32.884,-0.162,-5.358,-16.25,53.43,52.825,0.02,36.618,52.643,12.602,-8.125,-1.697,-6.137,-21.244,-6.102,34.724,-6.892,-39.927,-16.355,-4.271,32.884,56.056,-35.223,-16.25,42.063,-0.37,-38.692,32.884,-39.157,-20.536,4.769,14.57,-7.242,13.813,-37.856,-59.063,-4.03,42.688,-8.058,-6.75,-6.102,-21.244,-4.08,-1.697,-0.077,-8.125,55.832,32.884,0.817,-20.32,-39.28,-1.697,42.688,20.538,1.22,32.884,55.417,-28.98,-59.063,-15.6,-39.42,-8.542,44.133,19.475,31.593,36.227,-16.25,2.78,37.734,-36.863,-7.942,-6.75,34.724,56.056,59.363,-6.72,11.538,0.02,32.884,-6.102,-21.244,24.751,64.42,-39.28,-39.157,36.406,54.049,50.686,30.789,19.421,-39.28,-2.005,32.884,20.538,-8.508,-39.157,36.406,31.888,34.724,64.42,-40.59,38.789,-4.03,-36.863,36.406,37.734,12.602,36.618,12.77,30.443,19.475,42.688,13.813,64.42,-8.125,50.861,0.8,52.076,34.724,-23.37,-7.542,54.049,1.693,-5.25,-5.576,19.7,-21.244,-7.242,-37.52,-20.32,9.979,-49.02,19.023,36.406,49.12,-39.42,-38.377,-35.653,0.02,-5.358,-16.507,-38.692,-21.38,10.412,-6.102,0.8,-7.542,-21.244,1.22,36.618,20.538,39.761,-7.242,-35.58,38.789,32.884,54.049,-8.542,-6.73,-38.692,36.227,54.756,56.056,14.473,52.825,44.808,-0.381,-4.08,-41.326,-0.92,10.2,19.421,53.93,42.688,-6.102,49.12,56.056,37.734,43.418,56.88,54.134,52.559,30.443,36.406,13.813,36.227,56.056,53.43,55.832,13.434,-39.157,-21.244,-0.677,3.67,-7.542,19.421,37.734,2.78,9.979,32.884,52.559,1.358,-38.692,56.17,-7.942,-21.244,36.406,-0.381,-7.242,13.813,-37.52,36.227,48.092,2.78,56.653,13.434,-17.436,24.751,25.424,-39.42,-21.244,52.974,-38.692,36.406,14.809,52.559,39.964,-7.942,37.734,13.434,11.538,-15.6,19.421,-16.25,-0.381,42.063,-7.242,56.056,54.756,-6.77,54.134,-8.125,36.227,51.79,55.417,19.421,12.506,52.449,36.406,-40.59,-41.326,12.602,64.65,10.2,-0.077,53.589,54.049,-6.75,12.38,-7.942,20.538,43.418,-36.863,37.734,-8.125,32.884,42.688,-37.52,34.724,-8.32,54.756,37.734,-39.157,12.77,-7.2,42.063,-7.242,-7.942,-39.157,48.092,9.979,56.653,52.449,11.538,36.404,42.688,43.418,13.257,-8.53,-11.75,-28.98,12.602,0.58,36.618,-6.102,36.227,-0.37,55.131,-38.692,-20.32,-8.125,12.602,19.421,-5.05,-36.863,10.412,-1.52,36.406,-7.242,-0.381,36.227,52.449,48.092,13.813,54.756,54.134,-8.342,-8.2,-39.42,2.32,53.891,53.321,-39.157,0.95,-7.242,-38.12,42.688,2.78,32.884,-21.244,-8.242,14.501,2.32,65.03,53.93,63.88,1.38,-4.03,-39.157,19.475,53.256,56.056,-6.77,-4.08,-37.52,-0.077,37.734,14.242,-2.764,19.514,-0.677,-0.37,-21.244,13.813,43.418,-39.157,2.32,36.404,54.049,29.638,0.02,56.056,-0.381,11.984,18.13,36.618,-39.28,32.884,-8.242,-8.342,-4.08,4.203,20.538,53.589,54.756,19.023,10.2,-33.425,14.501,36.227,-8.82,24.57,-39.157,1.22,-7.542,36.406,-21.244,42.063,19.421,-39.157,-21.244,19.421,2.78,-0.39,46.042,13.813,-8.242,9.979,48.08,48.292,-8.125,55.417,-39.157,-37.52,-38.12,-3.613,19.523,47.35,2.32,65.03,1.22,19.023,1.112,12.506,37.734,-1.697,19.421,56.056,-20.85,31.934,36.227,37.734,-7.242,-6.75,-4.03,0.8,-7.32,10.158,42.063,51.577,54.049,54.753,42.688,18.13,48.092,65.03,32.884,-8.242,3.58,-16.829,46.925,55.417,34.724,54.753,65.03,-38.692,-39.42,54.756,10.463,64.42,-8.242,24.751,-16.507,14.756,3.67,19.421,42.063,2.78,56.056,10.83,36.227,-7.542,-7.942,4.203,-4.08,-37.52,51.79,-0.677,2.32,-40.59,29.638,11.538,-21.244,-39.28,-6.312,54.049,42.688,-7.942,-2.414,-1.697,-4.03,19.421,2.78,65.03,-8.125,3.67,-2.764,-8.242,-8.542,-1.408,36.227,-39.42,36.406,-7.93,-4.08,13.813,13.434,-7.542,42.688,-21.244,-16.68,-5.576,-1.408,-1.52,-8.272,32.884,36.227,-42.377,19.421,13.434,4.769,36.227,-6.312,19.475,-4.08,39.853,12.506,42.063,-5.05,-7.93,34.724,42.688,19.523,32.884,37.734,36.406,-0.381,19.023,19.421,-6.72,11.984,-40.59,65.03,64.42,37.734,63.63,12.77,-0.381,-11.75,0.8,-5.05,3.138,-7.25,-39.28,42.688,19.523,-0.381,37.734,19.421,32.884,-7.542,11.984,11.538,-1.52,-38.12,4.914,36.227,1.112,1.38,-39.157,55.417,9.979,52.449,37.734,-0.381,13.734,0.686,36.406,42.688,-21.244,18.77,-41.326,-38.12,-8.058,-8.125,-38.692,-34.814,19.523,-4.08,2.32,18.13,36.227,-2.764,52.449,-8.125,52.449,31.44,19.475,36.406,-0.381,32.884,36.227,-1.467,12.77,10.2,4.892,-35.653,-0.381,-38.12,-8.42,-7.942,-16.25,34.724,-77.53,-21.244,36.227,36.406,-8.125,1.112,-5.05,-7.542,-77.53,-38.12,36.227,31.888,56.056,-18.53,54.049,12.888,-8.108,-39.42,19.475,36.406,31.934,12.506,10.2,-35.653,-39.157,-2.764,55.417,-38.692,-0.381,-8.542,46.815,-0.39,40.492,10.2,2.3,34.724,-40.59,-38.12,32.884,24.285,31.593,30.443,29.859,51.885,-36.863,37.734,31.934,-16.25,36.227,58.236,11.984,-21.244,40.821,-0.381,-8.108,-8.125,-39.157,63.98,1.112,3.67,-38.12,19.514,56.056,-39.157,-3.613,-2.764,-19.15,-18.42,-77.53,-1.408,-15.6,-8.108,37.734,10.83,58.28,58.27,-20.536,-38.12,-8.2,34.724,36.227,-0.077,-35.653,13.813,54.049,20.538,-16.25,-38.692,-34.164,-63.001,-0.83,-8.108,-57.08,-0.381,1.112,56.056,-77.53,37.734,0.8,-21.88,1.488,37.734,-1.52,-20.85,36.227,62.006,-77.53,37.6,-8.2,14.002,32.884,1.38,-5.576,-4.92,54.134,54.049,-41.326,37.734,34.724,-21.244,-8.108,1.112,36.227,-3.25,-39.157,10.2,56.056,42.544,-38.12,64.63,38.789,-8.82,-6.77,32.884,37.734,-53.106,-11.75,-52.33,37.734,10.2,-7.942,-39.157,-8.292,-16.25,1.5,-8.53,-0.381,64.42,-8.42,28.271,-8.342,-8.108,53.93,-39.42,53.256,-10.38,-16.25,-2.414,56.056,-37.52,-6.77,-1.408,4.203,-3.613,-21.244,32.884,-39.157,-41.326,-7.542,36.406,-7.942,42.688,-8.542,-4.08,18.13,14.95,19.514,-39.42,-38.12,-1.697,36.406,-6.137,-3.613,1.112,37.734,37.734,-77.53,54.134,-4.03,36.406,32.884,-8.108,-7.542,-1.408,-16.25,-16.507,59.363,54.049,-50.964,-0.677,-0.381,-7.942,32.884,36.227,-21.244,0.8,-1.408,-3.613,-39.157,12.602,-8.542,11.538,-7.942,36.406,56.056,-35.653,-8.108,-21.38,1.112,12.888,-0.677,-39.42,-41.326,-40.35,37.6,-1.408,51.844,-33.425,-39.157,36.406,19.475,-8.108,-3.52,19.523,-5.525,-2.764,54.134,53.891,52.381,-36.863,-38.692,-16.355,38.65,19.421,-19.75,-16.355,-7.942,-7.3,-0.677,-36.863,1.112,32.884,13.6,51.923,-8.42,-39.42,31.888,36.406,-39.28,53.93,-39.157,-18.02,-38.12,-7.542,11.984,-19.75,-1.52,55.417,19.671,49.57,2.32,-35.653,-41.326,-42.377,10.412,-0.381,-8.73,-34.164,36.618,42.063,-8.108,-13.612,-1.408,-38.12,2.78,19.421,-38.12,-21.244,12.422,-7.542,56.653,38.144,-4.03,-8.242,-1.52,-39.157,-0.677,-40.59,-62.1,-39.157,24.285,-4.08,1.352,3.138,-21.244,-4.92,36.406,-7.242,-6.976,11.984,-4.08,2.3,-0.381,3.138,52.449,14.002,-1.408,-11.75,56.056,13.853,-8.108,-8.342,-8.242,10.412,-2.764,19.514,51.923,55.832,-0.22,-39.42,-6.73,-8.125,19.421,13.813,-7.3,-0.677,19.475,31.934,-38.692,41.98,14.002,-8.108,27.881,19.514,-77.53,14.756,3.58,-21.244,-39.28,-22.4,-7.542,64.42,64.63,-13.612,14.756,-21.244,30.484,36.406,36.618,62.006,11.984,19.421,13.813,38.65,13.33,-7.3,14.809,-1.408,12.422,-8.125,19.421,36.406,-7.542,10.412,60.485,-1.52,13.257,-6.72,52.315,39.761,11.538,2.32,-23.37,-39.42,53.256,-21.244,-8.42,-21.88,-7.93,-4.523,-33.425,-21.244,1.112,-8.108,1.693,-1.52,-1.408,51.498,55.417,54.756,-8.42,-4.03,36.618,37.647,-4.03,62.006,-21.244,-8.108,13.257,36.406,-38.12,-5.525,-1.52,8.158,2.78,19.077,20.538,48.98,-57.787,-42.377,13.813,-8.108,12.506,37.734,62.006,37.647,-8.108,31.934,37.734,36.406,19.475,-8.272,-6.77,36.406,-21.244,-1.408,-8.108,-66.78,2.32,2.78,-1.52,-6.137,-4.08,53.43,10.2,31.934,43.453,-21.244,32.884,-16.507,0.8,-0.162,-0.077,52.449,-16.25,-8.108,56.056,31.934,-7.979,-21.244,-39.157,-5.05,-1.52,3.58,41.98,54.756,-23.37,-36.863,-39.42,1.5,6.013,0.8,36.618,19.421,-16.829,13.257,-6.137,31.934,2.32,-8.125,-10.38,32.884,-21.244,-8.108,-33.425,-0.22,64.42,-8.242,-7.542,-39.157,52.825,56.653,31.934,56.056,-39.157,-7.979,63.43,13.257,-8.125,19.421,-6.77,-8.108,19.475,38.144,14.473,19.421,54.134,31.888,-7.942,-38.12,-1.408,-42.377,0.8,-22.4,38.144,54.134,13.257,31.934,-4.03,3.138,-4.649,-8.108,-39.28,37.735,38.144,-5.094,2.32,-33.789,-38.692,-0.677,-0.538,10.2,46.853,-41.326,-7.25,-16.25,-7.542,53.256,42.688,-21.244,46.042,38.144,-1.408,10.412,36.406,37.735,32.884,31.934,42.688,-7.542,12.77,-1.52,-6.137,50.861,55.417,-0.077,-8.108,19.514,-39.42,-38.692,-7.979,37.735,13.257,-7.542,10.412,37.735,37.734,1.358,-36.863,-7.942,-41.326,0.686,-8.108,3.67,52.825,-42.377,-40.59,-39.157,19.475,-39.157,-16.507,54.134,56.17,37.734,37.734,2.78,3.67,-7.125,0.686,52.315,-8.108,-39.157,12.77,55.417,-38.692,-74.35,52.315,31.934,64.42,36.77,13.257,36.406,-7.979,-7.542,19.514,31.934,11.538,37.734,-36.863,-21.88,-45.9,1.22,-1.52,-1.458,-6.77,13.813,39.761,-4.523,19.514,39.964,13.257,-7.979,36.799,-7.242,-8.125,0.32,44.133,-7.942,37.734,56.113,56.056,13.813,-7.979,-21.244,38.789,-9.2,-5.525,1.112,-18.175,53.321,13.434,-42.377,-39.42,24.751,36.406,31.934,36.799,29.638,-7.979,3.138,-35.223,44.133,19.514,1.22,-7.542,2.3,-21.244,-39.28,-38.692,-0.381,-0.39,-8.108,-8.542,12.77,43.418,-33.789,-33.425,13.257,36.586,-7.979,-7.542,38.404,37.601,-8.242,42.063,37.734,-5.519,-16.25,31.934,-0.381,-8.108,10.2,-0.37,2.32,2.63,-8.82,-8.342,-6.77,-7.3,-7.979,-6.77,42.688,64.42,-8.108,-7.979,-38.377,-4.08,43.418,37.734,2.78,31.934,-1.697,-5.519,-8.108,19.475,-38.692,19.514,13.813,54.134,39.964,-15.6,7.877,-7.942,-37.52,-15.6,13.257,-16.25,-38.12,-6.77,-39.157,12.422,37.734,2.78,-7.942,42.688,-0.381,-29.27,-8.108,-1.467,38.404,-0.677,9.979,-3.25,-19.18,-10.38,-5.2,12.77,55.417,19.514,14.381,-7.625,13.257,-0.381,-7.942,-20.32,-19.75,-37.52,-8.342,3.67,-0.677,-8.125,-7.942,2.32,-4.08,-7.242,-7.979,-7.542,42.688,29.638,-1.467,9.979,-19.15,1.38,-39.157,-4.649,13.813,-8.108,-8.42,47.52,-4.03,0.8,32.884,13.813,13.853,-21.244,13.434,19.421,-7.979,29.638,-1.52,37.734,-5.525,-16.25,48.98,11.538,-6.137,-7.2,-0.381,-0.677,42.688,59.363,53.93,13.813,3.67,2.78,-7.3,-0.677,56.056,-0.381,-6.102,45.389,-39.157,46.815,-7.979,11.538,-2.38,37.734,-11.75,64.42,-7.542,19.7,-16.25,-16.507,15.55,49.12,17.307,53.891,54.134,54.756,-38.692,-23.37,-39.42,13.434,12.422,56.056,36.618,13.813,-7.3,-0.677,-8.897,7.647,-1.408,-2.764,19.514,53.589,-4.03,46.815,13.257,-39.157,37.125,-8.365,-0.171,-4.03,13.813,53.256,-8.125,3.248,-18.75,2.32,-33.789,19.514,-2.764,19.475,48.777,31.934,14.473,19.475,-4.03,13.853,-0.677,15.307,-39.42,10.2,37.87,55.417,43.979,25.424,-8.25,1.518,-11.75,13.672,13.813,19.514,36.406,63.88,37.734,-4.03,46.525,19.475,-0.677,-39.42,13.853,48.092,56.056,56.653,-8.108,0.686,-49.02,-50.964,37.734,-1.697,14.002,12.422,-39.157,56.056,2.32,-0.677,-19.18,-21.244,63.98,-19.15,-4.271,-35.223,-5.525,-5.05,-3.25,-7.542,-8.108,53.13,53.43,52.5,13.813,15.132,53.256,0.95,-3.613,-4.08,-8.108,-24.72,-7.979,-7.942,-8.108,-39.42,19.475,-36.863,-38.692,-0.677,-19.15,-21.88,56.056,29.638,-20.32,34.724,-21.244,13.257,-49.02,44.133,-0.381,-0.381,13.257,19.475,60.032,-8.365,-0.978,-11.75,40.821,-21.244,-39.42,-7.242,19.475,3.67,36.406,-7.242,19.475,65.03,-23.37,-38.692,9.979,19.514,9.83,2.3,37.734,14.002,56.17,34.094,-21.244,19.514,41.805,-3.613,-7.979,37.734,-39.42,42.688,32.884,-21.244,-16.507,-1.697,20.538,13.853,38.404,38.144,13.257,36.586,19.475,36.799,7.7,64.42,19.475,51.79,51.93,18.13,14.002,-3.52,-8.365,32.884,13.813,-7.542,-8.108,13.257,-7.979,19.475,-36.863,-38.692,-39.5,36.799,-7.542,19.514,-3.613,-11.75,48.875,64.63,13.257,7.7,-0.381,-8.897,19.475,0.8,-21.244,9.203,-0.381,30.484,2.3,-0.077,-63.001,-16.25,-10.38,2.32,4.203,36.586,31.888,-39.42,40.821,2.32,2.3,-7.979,-6.77,-29.27,31.44,-39.157,-7.979,21.125,19.514,48.777,34.724,-15.4,-8.53,-0.677,12.422,2.32,-16.355,37.734,-7.979,-19.15,-39.157,-0.171,-8.542,-0.677,19.514,31.888,36.406,-7.979,-38.692,13.813,-10.38,-0.171,-39.42,-41.1,-37.406,-50.964,-39.157,-21.244,52.559,13.257,-8.542,37.734,0.8,-3.52,-24.72,-0.677,-0.171,-8.542,-8.897,19.421,19.475,-0.171,0.8,-21.244,13.813,27.881,1.693,4.203,-19.15,13.434,-7.942,66.3,12.506,38.144,42.688,64.42,38.73,-16.355,-8.108,-15.6,13.813,-8.897,37.1,60.032,54.134,39.964,-0.677,-37.856,-0.677,-6.77,-14.175,-7.942,13.813,55.417,36.404,4.203,10.025,-38.692,10.412,19.475,-7.942,-7.542,1.22,45.374,56.056,38.75,-8.542,-8.108,-7.942,-21.244,37.734,-11.75,4.203,-6.137,-8.77,7.647,53.891,54.134,-16.355,-20.939,-1.408,0.8,-39.157,-36.863,-39.927,-39.42,0.32,9.979,10.025,37.734,-8.125,-7.979,-16.507,2.78,13.813,40.821,0.8,20.538,-7.93,18.13,-8.272,-38.692,-21.244,-37.406,0.32,37.1,-19.15,48.777,-0.381,37.734,40.656,13.813,-0.914,15.55,-16.507,-16.25,-39.157,-0.677,0.8,64.63,-7.542,13.434,-39.157,9.203,13.257,-38.692,-16.355,0.32,-36.863,-39.28,13.579,-8.542,-0.381,-21.244,-37.406,-33.425,37.87,-13.8,-7.979,-7.542,13.257,-11.75,18.222,-8.2,-8.125,14.473,-36.863,50.861,-7.942,63.63,-8.108,-7.242,-21.244,13.257,19.523,31.593,45.338,-18.53,-35.223,10.2,-0.83,-0.677,2.32,-8.125,13.813,48.777,50.686,0.02,12.98,45.374,-39.42,-21.244,-39.157,-7.979,-7.942,19.475,13.257,-6.312,-11.75,-0.677,11.984,-21.244,-0.677,-7.942,-23.37,-7.942,7.7,13.813,13.257,-6.312,-11.75,-19.18,48.777,12.422,13.434,14.473,-1.467,-8.108,-10.38,46.525,14.95,46.2,13.813,-39.157,14.473,44.133,43.418,38.789,-11.75,-7.942,13.257,18.83,-0.677,-0.077,11.984,7.7,-0.677,19.077,14.473,42.063,-7.942,-8.108,2.3,13.813,-0.677,4.769,32.884,3.67,-7.979,14.473,-13.8,40.821,13.434,-0.677,-0.381,14.473,19.475,-10.38,-11.75,53.256,10.025,13.257,27.881,48.875,-2.68,39.356,-39.157,-41.1,40.821,-0.677,54.049,-0.381,53.256,50.267,50.861,46.525,13.813,-8.242,-0.677,32.884,56.653,-24.72,12.422,46.2,-23.37,20.33,-39.3,-18.806,-19.75,48.777,36.921,10.83,64.42,53.256,52.449,50.324,-3.52,-39.42,24,56.056,-0.677,13.257,-15.6,14.583,42.544,11.984,46.2,-6.77,-38.377,-4.03,52.449,10.83,10.025,48.777,12.98,36.921,-37.406,-8.272,37.734,56.056,11.984,-6.77,54.135,52.449,14.95,19.475,56.056,54.134,54.049,4.203,-21.244,-18.992,12.422,-0.677,-38.692,53.256,54.135,19.475,14.809,-0.677,13.257,-7.93,-8.108,-19.18,-21.244,-41.1,71.087,-21.244,12.506,46.2,13.813,17.36,-11.75,32.333,-4.271,20.33,-0.677,-0.92,-40.969,-62.1,-39.42,-8.125,-7.242,0.8,-8.272,0.02,-7.542,-7.979,19.475,-7.542,-8.242,-21.244,46.815,12.422,10.83,-8.108,-7.93,-6.77,46.2,54.134,-8.108,-21.244,-11.75,43.844,49.12,52.449,56.056,-23.37,-7.2,2.32,-6.77,-7.143,-7.979,-8.42,0.8,9.979,14.95,-7.979,46.2,-7.242,0.8,-7.792,-21.244,-35.653,41.805,-0.37,37.1,-7.542,-6.312,37.125,55.417,-18.02,-6.77,0.8,13.257,-7.542,14.381,19.03,34.724,49.12,48.875,47.77,1.352,-21.244,-0.381,63.98,55.417,-0.978,40.656,-0.677,-37.406,4.892,1.112,-6.77,13.257,-8.108,0.75,-21.244,46.042,-21.244,-7.942,-39.157,-8.108,-6.312,13.434,13.813,-8.897,10.83,40.656,-21.244,-0.677,-0.077,-0.83,-0.077,-7.143,37.734,-0.978,-7.979,-6.77,14.583,47.35,0.8,19.475,-7.143,-7.942,-8.342,1.518,-21.244,48.777,45.338,-0.077,46.2,37.734,0.8,46.815,-21.244,-6.137,-63.001,-7.942,-8.108,-6.77,-1.697,14.002,13.813,54.756,9.979,-7.143,40.821,-7.979,30.443,-22.4,-77.53,-39.157,-39.42,-6.77,39.7,19.421,-7.143,0.8,7.7,-7.542,2.3,30.443,-10.38,-17.436,56.056,2.32,36.571,-66.78,-39.157,0.8,4.769,5.448,13.257,-4.03,4.203,-7.979,56.17,37.734,-7.979,-8.108,64.42,32.884,0.8,-8.125,-1.697,54.756,55.417,13.813,-33.789,-41.1,-39.42,32.884,4.769,-7.542,14.583,-35.223,16.044,-7.143,-8.108,36.571,2.3,-37.52,13.813,-39.42,34.094,-7.242,32.884,3.138,46.2,-42.793,2.32,12.98,0.8,40.821,-22.4,-9.13,28.797,-7.93,-7.942,-35.223,-7.143,-41.1,-42.793,-3.52,39.099,7.7,13.257,10.2,1.22,15.55,50.686,-3.52,-0.978,-7.143,0.8,38.144,14.583,1.112,-11.75,-0.381,-7.542,-39.42,37.734,-6.77,-7.143,19.475,31.934,-8.108,-21.244,12.278,52.559,-7.143,19.421,38.144,46.2,37.1,0.8,-0.171,4.892,19.523,-8.108,-7.942,54.756,-21.244,32.884,54.65,63.88,-7.942,32.884,-7.979,-8.82,-11.75,-4.08,52.643,53.13,38.144,54.049,-16.355,-0.171,27.881,-7.942,-34.164,56.056,4.892,32.884,-6.77,1.358,-8.108,-7.979,-7.143,0.686,51.885,14.473,-33.425,-37.406,-7.542,1.22,4.892,32.884,52.559,-7.143,-11.75,53.256,51.95,52.894,10.2,2.32,32.884,14.583,53.256,13.257,-7.143,32.884,14.583,54.518,54.756,9.203,-63.001,-37.52,14.583,54.65,-7.2,-6.77,-7.93,32.884,53.891,4.658,-34.164,54.756,14.473,-7.979,-39.42,-7.942,-7.242,-7.143,4.658,-0.37,-18.42,55.417,54.756,13.813,47.02,18.13,-7.2,-7.93,14.002,-4.523,2.78,4.203,-21.244,29.03,40.821,-4.523,-21.244,-7.979,15.05,54.756,52.643,53.43,19.421,63.63,1.22,64.42,19.421,-57.08,-59.063,9.979,-7.942,-7.542,-39.42,-33.789,4.658,-7.25,-0.381,9.979,38.144,42.544,31.934,34.724,-37.144,-38.692,-11.75,63.63,-7.979,39.099,-8.2,-8.242,-21.244,38.144,34.724,1.518,37.734,-54.95,-4.523,-21.244,8.975,8.8,-16.25,10.285,-7.942,-18.175,19.421,54.518,48.777,42.491,-37.406,-57.787,-56.3,-8.25,13.434,37.734,-0.37,-8.272,1.112,56.056,19.514,-8.108,-7.143,-7.979,71.087,19.514,14.797,-7.3,-4.03,53.43,-8.125,-8.058,-21.244,-7.979,53.13,55.417,13.813,-0.37,-0.83,14.95,-21.244,-4.523,-7.143,32.884,64.42,2.32,-8.125,-7.143,-21.244,-7.942,36.406,32.884,-21.244,-39.42,-11.75,0.8,-21.244,-0.37,-29.27,13.257,13.33,32.884,-15.6,57.751,-21.244,-0.37,-0.83,-0.18,56.056,29.638,0.8,44.808,56.056,3.67,-21.244,44.353,13.33,16.044,52.331,59.363,-8.125,-8.25,-7.542,37.734,37.87,46.525,-7.93,0.8,37.87,34.094,-21.244,17.05,-7.542,-22.55,-21.244,38.144,-7.143,37.734,-7.979,0,38.65,14.002,2.3,-8.342,-11.75,37.601,43.384,-7.143,-21.244,56.056,4.203,-0.381,-7.542,38.144,32.884,-7.979,-37.406,-39.42,-7.3,53.93,19.514,-6.892,4.892,13.813,14.381,53.43,36.618,48.092,32.884,-7.942,38.144,42.688,54.135,19.514,-8.125,-8.242,36.406,12.278,34.724,36.406,-7.143,-0.677,37.734,-21.244,37.734,-17.026,19.023,13.813,53.891,-21.244,1.518,-0.481,39.099,-21.244,13.257,0.02,38.65,46.2,19.692,56.58,37.735,18.13,44.076,-7.143,-9.229,-5.576,-39.3,-63.001,-16.755,14.95,31.593,-7.979,14.473,28.271,13.813,-39.42,16.044,0.02,-0.077,64.63,65.03,31.593,-7.45,-7.542,-10.38,-21.244,1.22,27.881,53.93,38.144,40.821,-8.058,55.424,54.518,12.278,19.514,54.518,54.65,-21.244,38.144,19.514,18.57,-21.244,31.593,64.63,-5.519,13.813,18.57,50.686,55.832,-38.72,37.734,-8.125,-21.244,52.076,37.734,37.734,32.761,14.809,-41.326,-19.75,51.79,34.724,31.593,56.056,-21.244,-4.271,56.056,37.734,12.602,-18.02,-7.542,51.79,19.421,40.656,31.593,-41.1,-39.42,41.51,50.861,46.525,55.832,51.79,55.417,19.421,38,14.002,-18.806,1.352,56.056,-21.244,12.278,55.832,34.724,56.056,56.056,55.832,1.352,13.434,56.056,-16.294,-21.244,37.734,12.278,41.276,37.601,-39.42,-17.026,-7.542,-21.244,52.5,52.315,41.409,-7.2,1.112,31.593,56.056,0.029,14.95,24.841,-7.93,-16.294,-15.78,13.33,19.692,-21.244,-16.355,31.593,40.821,13.813,36.406,63.88,64.42,34.724,51.923,40.656,31.593,45.374,37.734,-19.18,32.884,19.514,32.458,37.734,38.404,-7.143,-6.72,25.424,46.042,43.384,-39.42,31.593,53.256,45.389,48.292,60.032,-4.523,34.724,36.406,-7.143,-39.42,52.543,53.589,36.406,-1.467,51.95,48.72,-7.93,37.734,-21.244,0.8,14.381,-6.892,-4.523,1.358,-21.244,8.158,9.979,-19.75,64.42,-19.53,-16.25,-21.244,52.894,0.8,20.33,19.077,-4.523,-1.467,0.8,36.921,-0.375,-21.244,-7.32,-6.892,-7.242,11.984,-21.244,32.884,53.256,13.813,56.056,0.8,38.404,-7.93,31.934,-21.244,19.514,54.049,-39.42,0.8,56.056,19.514,13.813,40.821,-0.904,-0.381,36.406,14.95,55.832,42.544,47.52,19.514,31.934,64.63,13.434,-7.542,-10.38,-0.677,64.42,-21.244,31.934,53.891,-4.271,37.734,56.056,48.958,-39.42,13.257,64.63,37.734,63.98,-21.244,-0.677,13.83,14.797,-4.523,32.884,7.7,48.292,48.092,47.02,-41.1,12.602,10.83,12.422,37.734,40.821,34.094,37.734,37.734,0.8,-35.223,36.406,56.056,55.417,-4.523,13.434,38.73,-6.77,-39.42,-21.244,0.32,-13.612,52.177,-0.375,-39.42,-38.692,19.85,41.51,-21.244,-40.59,-0.22,37.734,38.65,31.593,63.63,66.67,36.406,37.734,-39.3,-7.542,36.406,14.002,1.22,64.42,-21.244,36.406,-7.93,-37.406,-36.863,-7.542,-37.144,-37.92,-38.692,-39.42,-35.223,-21.244,-0.677,-15.78,10.463,-37.406,-37.856,-39.887,64.63,20.708,19.475,19.421,52.559,51.844,52.449,15.55,31.593,14.002,-4.523,-36.863,-0.481,-0.677,10.2,-6.77,65.73,36.227,-0.677,-39.42,-7.542,40.821,-0.677,38.961,19.514,19.514,-0.677,-0.677,-0.677,-0.677,31.593,40.821,-39.42,-42.793,41.51,55.832,39.099,56.056,55.678,-0.677,-45.9,42.688,55.832,43.664,56.653,0.8,64.63,-0.677,-39.42,56.056,14.473,53.256,0.8,12.422,-21.244,13.853,-21.244,36.406,-21.244,40.821,37.734,36.406,71.087,14.473,39.853,36.406,38.404,14.002,29.03,14.473,-39.42,64.42,19.475,54.049,-7.384,-8.125,-5.576,36.406,64.65,65.73,64.65,36.406,14.002,64.63,65.73,36.406,-2.005,65.73,37.734,65.73,64,38.404,56.056,9.979,64.63,38.961,63.98,64.42,48.875,40.821,65.73,36.406,9.979,36.406,13.853,-4.523,36.406,-21.244,63.63,-39.42,38.23,38.47,36.406,48.72,19.023,56.056,-29.27,64.63,5.091,36.406,1.693,31.934,-41.1,36.406,13.33,38.47,36.406,31.934,14.583,14.473,64.63,31.934,64.42,64.63,14.002,-7.93,31.934,-39.42,14.002,-8.2,-39.42,36.406,49.12,37.87,46.525,28.57,-4.523,34.094,2.78,64.63,3.67,36.406,37.735,19.514,14.473,36.406,47.52,49.57,58.336,-44.7,32.884,14.002,-21.244,12.98,-39.42,36.406,40.821,-21.244,-39.42,35.361,36.404,14.002,42.688,64.63,36.406,64.42,14.473,28.271,31.934,31.593,64.63,14.473,-39.42,28.271,36.406,36.406,-21.244,14.473,41.98,37.734,64.63,40.821,-4.08,-5.519,-5.05,-39.3,1.5,56.653,48.112,55.424,19.421,35.361,-37.092,0.029,14.381,-6.642,14.473,13.434,-6.892,-0.677,19.023,40.821,56.056,64.63,64.42,40.821,16.044,36.406,34.724,-42.377,42.063,38.144,-6.312,1.518,37.734,-6.312,63.98,-6.976,14.381,32.884,-0.077,16.044,31.934,-4.523,-7.143,14.381,19.514,55.12,42.544,50.324,51.356,37.734,37.734,38.404,-39.42,-6.312,0.8,14.381,19.03,0.8,39.853,14.473,40.821,14.473,12.702,12.602,19.475,64.42,12.702,34.724,-6.102,32.884,-4.523,1.518,-6.312,-62.1,37.87,37.734,40.821,-39.42,64.42,-6.102,1.518,19.475,12.702,-7.542,14.381,31.593,31.934,39.964,28.57,-16.294,-16.355,31.934,-7.542,0.8,33.086,32.884,2.78,-8.542,-39.42,14.381,1.38,-7.542,38.6,-21.244,-39.42,14.381,-21.244,-8.897,38.144,32.458,50.686,-15.4,1.22,11.984,36.406,37.734,-21.244,38.144,18.13,-39.42,38.144,14.381,32.884,41.98,32.884,42.688,-16.355,19.023,40.492,64.42,18.57,14.381,27.881,-7.542,32.761,19.023,42.544,32.761,-6.976,14.583,31.934,33.086,-16.355,36.406,36.406,63.63,-0.171,36.406,-6.976,-8.272,-5.358,-19.12,-35.223,-6.976,64.42,36.406,0.8,36.155,39.099,31.934,13.734,36.155,36.406,-7.542,36.406,-39.42,36.406,36.406,14.381,64.65,-39.3,40.821,37.734,0.8,37.78,36.406,32.458,56.653,19.523,36.406,14.381,37.734,38.404,38.654,36.404,50.686,52.449,9.83,19.421,19.692,19.475,60.485,61.299,59.363,60.032,4.203,-5.2,-9.13,-8.32,-36.863,45.95,36.406,32.884,36.799,-21.244,36.406,0.8,36.406,-39.42,36.406,37.734,28.57,0.32,3.67,36.406,14.002,-39.42,36.406,-41.1,-1.467,-4.08,-4.649,34.094,37.734,31.593,19.023,-39.42,14.002,-7.93,38.144,1.22,-63.001,6.113,42.063,-38.692,-41.1,17.63,13.33,-1.467,19.475,-21.244,-42.833,42.544,37.87,64.42,-8.125,-39.42,63.43,32.884,34.724,40.821,31.934,63.98,-4.523,0.8,14.002,14.809,37.734,14.002,34.724,-4.523,37.1,64.42,-39.42,40.821,32.884,11.28,38.404,37.77,-29.27,38.144,14.473,64.42,31.934,-2.005,42.544,38.404,63.63,36.799,-17.436,-39.42,38.144,14.473,14.381,34.724,4.892,19.514,38.144,64.42,32.884,31.934,14.473,-18.53,38.144,64.42,40.656,38.404,14.473,-39.42,-4.08,1.22,13.257,-4.523,31.934,37.734,14.473,32.884,31.934,19.03,12.602,34.724,63.63,32.884,63.63,-39.42,19.514,32.884,37.734,-13.612,19.421,46.2,64.42,-39.42,36.406,-4.523,0.8,14.002,37.734,19.514,33.137,36.406,33.137,0.8,12.422,40.656,-39.42,64.42,37.734,34.724,40.656,40.656,-16.608,36.406,50.686,43.384,9.83,56.7,-21.244,29.638,16.044,-41.326,-39.42,32.884,64.42,36.406,31.934,-4.523,36.406,-8.125,63.98,38.654,36.406,34.094,36.406,4.892,31.934,-10.38,-39.42,-8.125,32.884,19.023,36.406,36.406,14.002,36.406,19.514,19.023,56.58,-7.942,-39.3,-0.077,0.029,31.934,14.473,31.934,32.884,-7.542,14.473,-4.523,-7.93,36.227,31.934,28.57,14.473,19.514,32.884,-7.542,-39.42,32.884,63.88,36.406,-0.171,32.884,36.406,36.155,-39.42,14.473,1.22,63.63,38.65,19.023,-6.092,36.155,37.734,14.583,-39.42,12.422,32.884,31.934,13.853,19.514,-0.171,-41.1,13.734,31.934,32.884,32.884,14.002,19.023,13.853,45.1,43.418,36.404,40.821,-39.3,0.029,11.984,4.892,19.03,-9.13,21.125,37.734,31.934,-0.171,31.934,19.03,14.381,1.38,32.884,37.77,-39.42,37.77,38.47,32.884,-39.42,0.8,19.514,56.88,30.443,-7.45,-7.542,-39.3,9.979,-45.1,32.884,38.789,-39.42,-1.467,2.93,63.98,36.155,31.934,-7.542,-39.42,34.724,14.473,11.984,1.693,0.32,38.404,-1.408,-39.3,-16.82,-5.576,38,56.88,52.33,51.885,51.873,56.653,40.659,42.688,43.384,53.256,54.049,55.832,54.135,54.596,54.489,8.808,-0.37,-16.355,16.72,13.33,63.63,-42.793,36.155,19.023,-7.542,-7.93,36.155,19.03,36.955,26.06,-39.42,32.884,14.473,19.023,21.125,37.734,-0.077,14.473,37.734,19.475,59.363,19.023,-39.42,40.827,0.8,-39.42,37.734,-39.42,37.734,34.094,1.22,-0.677,-0.677,32.884,-0.677,14.473,19.023,60.485,-15.4,-6.102,64.42,12.602,12.702,12.495,19.023,36.406,36.406,12.602,-39.42,46.2,14.473,13.853,31.934,11.984,12.422,-39.42,32.884,13.853,64.42,-39.42,19.023,19.514,33.137,19.023,-39.42,-39.42,19.023,-8.2,-6.642,35.361,63.98,64.42,13.434,19.421,19.475,60.485,0.8,5.448,64.42,-39.42,32.884,32.884,14.583,19.023,-39.42,63.63,12.98,64.42,-63.001,14.95,19.475,19.421,54.761,42.688,-39.3,-39.157,40.821,-39.42,-39.42,37.734,28.271,-39.42,-15.42,64.42,19.421,19.023,33.137,32.884,-39.42,46.2,-7.93,46.2,-7.542,-39.3,13.33,28.57,16.72,-39.42,31.593,63.92,64.63,-39.42,32.884,31.593,34.724,64.42,-39.42,64.42,36.618,19.475,30.443,-2.68,34.094,14.583,64.42,31.593,-39.42,-39.42,-7.93,20.708,19.421,36.227,45.1,14.809,-16.294,20.469,-39.42,0,-7.93,-7.93,15.13,1.112,-8.989,-29.27,-5.576,-4.271,54.049,38.961,39.853,14.501,46.853,64.42,63.63,0.02,-39.42,37.734,37.734,38.404,37.734,37.87,34.724,38.654,37.77,63.98,63.63,16.044,0.029,10.463,-21.244,30.443,-7.542,36.227,19.475,32.884,35.361,32.884,-39.42,64.42,37.77,30.789,-16.829,56.653,36.586,63.88,34.724,54.134,20.708,-16.82,-39.42,34.724,63.63,34.724,-39.42,-7.93,37.125,19.421,64.63,-39.42,37.734,37.125,37.125,-39.42,38.654,13.579,-39.3,38.144,53.256,54.135,51.923,60.485,10.463,38.73,45.95,37.125,13.33,-7.93,-39.42,64.42,39.964,19.475,56.88,63.98,-39.42,32.884,-7.93,-39.42,37.734,6.113,-7.542,37.692,-41.326,32.884,32.884,-7.93,32.884,1.358,-7.2,66.67,64.42,14.809,16.044,19.475,64.42,64,36.921,17.36,14.381,19.475,20.708,60.485,-35.004,63.63,64.42,19.023,20.708,37.88,54.489,54.596,53.83,44.076,51.306,49.57,41.805,-16.82,-13.612,-9.62,37.734,-2.764,-36.9,14.12,64.42,64.63,71.087,4.892,10.025,-0.677,-0.83,-1.467,-16.294,-15.78,19.023,32.884,63.98,64.42,63.92,32.884,30.789,-21.244,-39.3,19.421,18.13,40.659,63.93,63.88,16.044,14.809,8.808,34.724,32.884,-7.93,37.734,64.42,32.884,32.884,37.735,52.559,55.12,5.091,37.734,13.33,63.93,32.884,-6.102,43.608,63.63,-7.93,-38.12,-13.612,19.475,-41.1,64.42,34.724,32.884,40.73,63.98,65.03,65.73,1.5,-39.3,-7.542,39.853,52.449,55.678,45.95,40.73,6.37,38.97,43.844,64.63,64.42,0.029,32.884,37.734,43.25,32.884,-0.85,10.2,0,32.884,32.884,32.884,32.884,32.884,36.227,19.73,64.42,64.63,0.029,15.255,32.884,0,32.884,63.63,14.809,-0.677,19.03,37.631,45.95,0,-8.42,23.08,13.58,43.384,43.418,41.409,57.33,-9.135,8.975,37.734,64.63,-1.467,-0.92,50.267,34.724,63.63,63.88,-38.97,19.692,-13.612,32.884,32.884,36.155,63.88,31.934,63.88,38.144,59.363,-7.542,38.48,38.404,1.5,64.42,45.95,38.144,63.88,37.734,63.88,63.98,36.67,56.88,-41.1,-40.59,63.88,63.88,63.88,63.63,64.63,-39.28,63.98,-63.001,38.73,63.92,38.404,60.485,61.64,41.409,20.708,9.83,13.734,36.087,53.83,53.256,40.827,37.734,29.968,-7.542,17.36,19.475,14.809,64.42,63.93,31.934,38.144,34.724,-7.2,-38.42,4.487,16.72,63.88,63.63,0,19.03,19.475,35.233,37.77,63.92,0,31.934,37.734,37.734,1.5,-16.82,14.381,60.485,64.63,63.98,37.734,34.094,63.93,63.63,-0.18,-0.37,-0.02,64.42,54.049,19.492,19.692,38,56.653,51.923,53.891,40.821,-19.53,-6.102,-7.542,19.421,-40.59,40.821,19.475,-0.677,8.808,60.485,1.5,31.934,31.934,38.654,30.443,19.514,9.979,37.87,36.406,63.98,12.422,39.761,53.256,36.38,30.443,-4.92,2.32,-7.542,64.42,-41.755,34.094,35.361,-16.355,64.63,43.572,41.611,20.708,35.347,63.93,-4.649,-39.3,19.475,37.734,-0.83,12.12,64.42,28.271,63.98,5.091,2.32,-11.75,-5.576,-6.102,19.692,37.58,19.421,56.88,57.751,51.885,43.418,54.049,55.832,36.155,19.475,38.404,-13.612,0.029,40.821,56.653,35.361,52.559,60.485,15.132,2.32,-6.092,30.789,-1.467,10.463,10.463,-16.82,20.708,56.653,20.708,30.789,-7.542,64.42,33.361,40.821,33.361,63.92,12.3,57.33,54.761,37.88,51.844,53.589,53.83,55.832,25.17,-7.93,31.934,45.95,35.361,40.821,40.821,20.708,36.921,20.708,40.492,14.473,56.653,30.443,-39.3,40.821,-21.244,63.63,64.87,64.42,37.647,55.832,55.972,55.033,54.049,52.449,43.418,43.384,57.72,54.756,9.83,46.206,44.674,38.789,-5.576,-5.33,12.77,-6.102,-77.53,37.87,63.92,64.75,63.63,-0.677,0.02,-0.37,31.934,41.98,19.475,-7.542,37.78,64.63,39.099,35.361,63.63,35.361,21.125,59.363,-0.171,38.404,19.692,63.63,63.63,63.88,15.37,38.73,40.51,20.708,46.853,64.42,14.809,63.92,-41.1,13.33,63.93,-35.223,28.57,-63.001,48.112,19.421,14.473,53.256,54.489,55.832,40.821,18.57,41.611,14.809,1.22,36.921,34.724,34.397,31.22,38.144,-16.82,40.492,14.381,0.029,64.63,63.92,31.22,39.099,35.361,17.6,-7.542,63.92,64.63,32.884,33.282,32.884,35.361,40.821,-45.9,-40.59,31.934,31.934,34.397,34.724,34.094,33.137,44.133,55.972,54.596,55.131,9.83,19.421,41.409,51.923,57.35,-6.102,18.33,-29.27,-19.53,65.73,37.78,61.38,31.934,37.77,34.219,34.724,38.729,31.934,34.094,39.099,35.361,54.489,41.611,19.475,30.789,35.361,19.023,34.724,-39.3,40.73,38.73,63.63,39.099,36.921,19.475,39.761,37.601,35.361,36.799,53.83,41.611,40.492,14.797,55.678,-1.467,28.271,63.98,45.95,-5.094,20.708,15.37,31.934,40.821,35.361,46.2,17.36,38.48,63.63,31.593,33.282,19.692,31.22,-16.82,-0.677,31.593,31.593,-16.294,30.789,29.968,56.653,34.094,52.449,54.596,49.57,10.463,5.091,4.487,-27.109,63.98,31.934,-8.25,-0.677,-1.467,-4.649,19.514,38.404,36.404,31.22,41.611,60.485,35.361,14.809,31.593,34.724,39.099,-5.576,8.808,-41.326,31.593,36.155,34.724,43.608,55.131,55.972,51.844,53.256,56.88,56.653,31.934,-29.27,-2.764,10.463,28.271,29.03,37.77,-42.793,9.979,43.722,-5.576,36.227,36.406,40.821,34.724,-4.271,-7.542,34.724,44.411,19.421,19.475,63.63,4.892,37.87,31.22,34.724,-5.094,25,35.139,54.596,54.489,56.653,42.5,63.98,10.463,0.308,14.809,25.17,23.08,13.734,60.485,27.08,-16.82,15.307,10.025,0,-7.542,56.653,19.475,36.227,34.724,37.88,57.72,52.543,63.63,-21.244,30.443,31.22,55.972,43.384,43.418,34.724,37.735,56.653,19.475,-1.467,37.78,-63.001,63.63,17.36,14.473,56.653,60.485,34.724,39.964,59.363,-39.637,36.477,44.076,55.832,56.056,54.489,52.559,54.134,55.678,19.475,31.22,38.789,-29.27,-39.3,-19.53,63.63,-1.464,-0.677,-0.171,10.463,63.98,63.63,40.73,-7.542,19.421,19.514,17.6,40.821,35.361,56.653,38.404,36.477,35.361,60.485,-4.649,-39.3,-16.82,-41.326,40.821,0,29.03,63.63,-40.59,15.63,56.653,36.155,34.094,37.88,43.722,44.285,45.374,19.475,18.57,17.36,-16.82,-7.542,-1.467,40.821,-7.3,20.469,13.257,35.361,56.88,-21.244,19.475,19.421,36.477,40.659,43.608,55.033,55.832,13.672,14.809,37.88,44.133,60.485,46.853,32.884,10.83,9.979,-41.1,46.2,19.421,37.734,-6.102,-7.542,-45.1,45.95,14.381,19.08,54.65,55.832,53.256,39.761,35.361,-35.3,-16.82,-29.27,63.63,-39.637,10.463,-45.9,15.255,-39.3,30.789,53.75,56.653,18.57,37.87,40.821,35.361,33.086,16.044,-0.677,-0.83,36.406,35.361,51.844,55.832,55.131,43.572,51.452,43.418,38,19.475,42.33,-16.82,-2.38,-1.467,4.892,14.809,63.98,-19.12,54.134,59.363,34.724,-41.874,-39.42,37.125,-7.942,-16.82,34.094,37.88,-5.576,19.475,65.517,38.144,35.361,52.63,14.809,40.73,60.485,37.692,63.63,-18.166,0.038,-7.542,31.22,-16.82,46.2,-1.464,63.63,63.63,0.029,4.658,8.808,34.094,-38.82,0,37.734,38.789,20.469,-6.102,34.724,35.361,37.125,52.559,52.449,55.832,55.972,43.384,41.51,19.023,52.315,56.653,63.98,65.73,17.478,28.271,51.844,35.361,-38.82,-7.3,56.653,46.2,40.821,-16.82,19.03,35.361,-41.326,14.809,10.2,-0.18,40.821,15.63,35.361,36.155,52.559,54.5,42.491,19.08,46.206,19.475,51.923,48.112,56.88,-1.467,0.029,-44.08,63.63,64.8,28.271,38.73,62.006,60.485,46.2,17.36,-7.942,-7.542,-38.42,-38.12,-0.677,40.821,-13.612,56.653,0.029,17.37,37.77,-41.326,64.08,63.92,-0.677,0.02,11.984,64.63,38.789,-39.3,-5.416,31.22,41.409,19.421,19.475,43.572,55.972,55.832,34.724,39.853,40.73,38.404,36.699,19.03,-40.59,63.63,14.809,31.22,7.382,-7.542,-21.244,18.57,56.653,60.485,-40.59,-39.42,-1.467,-63.001,56.653,19.475,46.2,35.361,53.256,43.384,37.734,-39.3,-29.27,19.03,14.501,28.271,37.87,-18.166,-16.294,-39.637,37.77,20.708,44.076,40.73,40.821,44.38,15.132,60.485,38.73,-0.677,-0.171,61.38,17.37,14.809,55.678,42.5,41.409,19.475,52.559,52.449,51.498,55.832,55.972,35.361,36.618,38.404,38.789,43.351,-16.25,36.404,40.73,44.133,19.03,-41.326,10.025,28.271,28,37.734,31.22,28.271,63.63,-7.542,37.734,37.88,14.809,0.029,28,43.418,47.5,40.73,56.653,17.36,38.404,19.475,37.734,37.734,-39.3,37.734,37.734,38.789,-9.135,-2.764,7.77,-29.27,-7.2,-25.37,41.611,19.421,18.92,44.133,9.83,16.55,15.83,43.384,42.688,45.389,54.753,53.589,37.647,35.233,36.106,39.761,40.659,34.094,-54.408,65.73,64.42,-0.375,-0.677,-1.467,12.242,0,19.475,38.73,31.22,7.382,19.475,19.692,28.271,-16.294,63.63,64.08,-39.637,-52.33,38.73,60.485,-16.82,38.404,40.73,60.485,53.43,46.2,34.219,33.086,35.361,52.449,55.832,42.688,-63.001,-41.326,-1.467,42.6,59.363,-45.9,37.734,37.734,38.404,43.42,37.734,37.734,38.404,-39.3,41.409,18.57,46.853,56.653,54.596,37.735,33.137,34.724,63.98,2.32,60.485,-6.62,6.37,10.463,11.984,0,0,0.029,41.98,38.404,35.361,63.93,-41.25,36.404,40.73,-16.82,-38.82,36.155,33.282,39.761,55.832,52.449,51.844,19.023,19.421,19.475,63.88,14.809,4.658,4.892,0,-74.33,-41.1,60.485,38.789,38.404,40.821,60.485,56.28,46.2,53.589,-39.637,-40.771,0.029,-0.677,-7.93,-2.38,-29.27,54.596,37.125,46.2,46.853,-37.856,63.63,-63.001,63.98,37.1,37.615,43.42,14.501,0.029,-1.467,10.463,19.421,44.83,60.485,44.076,-5.2,31.22,30.789,46.2,20.708,19.475,46.206,42.88,56.653,43.384,52.062,-38.12,38.404,14.809,65.73,-16.294,59.363,-18.1,-0.353,-36.863,0,-41.326,-16.82,-7.542,0,-5.2,-4.08,38.789,59.363,60.485,56.88,57.832,54.761,43.42,44.133,19.692,52.559,54.596,36.227,39.761,39.853,33.137,38.404,37.77,28.57,63.63,40.73,14.501,60.485,10.463,60.485,20.708,50.686,37.734,-16.82,32.657,6.37,36.227,36.087,36.799,19.692,19.475,46.206,60.485,46.853,56.653,-0.677,63.88,50.63,19.421,60.485,-39.3,37.734,63.63,15.255,0,14.809,19.692,41.805,20.92,4.203,55.972,52.449,39.853,39.099,60.485,60.032,0.038,0.029,60.485,40.73,38.404,37.734,-13.612,40.73,1.22,-40.59,-1.467,65.73,-7.2,46.853,58.195,56.653,19.475,37.78,0.029,28.271,44.08,35.361,46.2,13.33,63.63,38.654,39.356,39.7,-39.157,46.206,41.409,51.885,53.891,57.4,58.195,37.601,36.618,40.656,53.905,54.974,55.064,54.135,54.528,43.384,43.664,42.688,49.57,63.63,17.478,-0.92,12.12,-63.001,27.73,0.029,63.63,-19.12,20.708,16.044,28.271,28,0,28,14.809,-39.637,37.647,-39.3,-41.88,14.809,63.63,40.821,-16.82,34.724,32.458,34.094,19.475,60.485,55.678,-8.42,60.485,46.853,4.658,14.809,28,56.58,60.485,32.884,-8.058,9.979,-5.576,31.593,31.22,46.853,58.195,56.7,56.653,41.409,19.514,39.099,54.135,54.596,4.487,63.63,65.73,63.98,38.654,56.7,64.87,-39.42,28.271,38.73,60.485,-16.82,0.038,37.734,40.73,31.22,-7.542,46.853,17.36,37.88,55.832,52.559,37.125,36.921,-15.83,63.63,-63.001,19.692,14.809,5.091,63.63,13.33,-63.001,37.87,63.98,42.7,18.57,57.72,36.891,34.9,40.51,34.219,55.832,10.2,11.538,60.485,40.028,56.653,19.03,41.611,35.361,63.63,38.654,60.485,-45.9,-52.33,12.422,-63.001,58.172,57.019,57.2,19.421,44.133,44.38,44.285,46.2,38.729,55.832,53.905,43.384,41.51,-38.82,-44.08,16.044,10.463,10.025,-7.942,46.2,60.485,48.112,41.409,53.905,54.049,54.596,54.135,24.751,36.227,4.818,4.892,63.63,37.78,63.98,63.63,60.485,-4.649,40.821,14.809,65.88,29.968,56.653,44.38,36.571,34.724,28,63.63,-38.97,1.08,35.361,52.062,40.73,-15.42,38.73,39.462,27.73,-0.92,0.308,15.307,38.404,53.98,37.735,34.094,19.475,56.653,14.156,-40.771,16.044,63.63,-40.59,33.086,54.596,64.8,-1.467,28,56.653,46.2,55.131,35.361,-38.82,-7.542,-16.82,14.583,44.285,35.361,60.485,63.92,-0.677,5.091,12.242,28.271,-72.67,60.485,64.062,51.885,9.83,-25.37,35.233,34.724,40.656,39.099,54.596,56.056,52.062,41.805,42.827,-38.82,-10.38,-6.52,37.734,15.13,31.593,39.284,63.93,57.35,60.485,19.692,41.611,15.132,36.77,-39.42,0,30.789,-16.82,46.2,60.485,54.049,32.458,63.98,-18.166,10.025,36.618,36.406,-39.3,30.443,20.708,19.514,19.85,19.692,41.409,60.485,52.22,34.9,33.137,39.853,40.659,54.596,32.761,-13.612,0.308,63.92,63.98,28.271,0,63.63,1.22,34.8,19.231,19.514,46.88,46.2,-7.542,28,63.63,-39.3,0,39.462,65.43,64.63,15.4,-16.82,-29.27,19.67,55.678,34.724,32.458,35.233,36.891,60.485,63.63,-0.171,-39.42,20.708,4.892,10.463,-0.83,-50.33,65.03,63.98,28,-57.08,43.147,33.137,34.094,34.397,39.853,39.964,-38.82,-39.3,-6.52,32.884,8.808,63.63,57.18,63.63,37.77,0.029,19.475,35.361,-16.82,38.404,20.708,60.485,5.091,16.044,-17.184,28.57,18.57,19.514,56.653,-0.914,-38.12,17.36,19.108,44.43,60.485,35.361,38.729,54.596,55.972,53.256,43.418,51.356,32.884,63.98,-5.576,14.809,38.654,54.049,38.729,35.233,28.271,-7.542,37.734,10.025,40.821,37.125,63.63,10.463,35.361,39.761,34.724,34.094,43.664,43.722,19.514,-16.82,32.761,30.443,31.22,0,0,-38.82,40.73,-40.59,37.734,31.22,19.03,56.653,53.256,39.853,50.324,35.361,60.485,-36.863,-0.677,63.63,60.485,44.08,51.923,58.28,60.485,61.64,19.421,37.647,43.608,52.543,53.321,53.905,55.972,54.5,31.22,40.821,-2.764,63.92,-63.001,63.98,-39.3,60.485,14.473,-18.1,-0.375,50.267,38.144,51.944,13.33,46.2,36.404,31.22,0,0,63.63,56.88,58.195,56.653,19.421,19.692,19.475,39.853,54.596,54.974,55.832,32.884,40.827,0.029,1.08,10.463,63.98,28.271,38.654,37.77,63.63,43.42,46.2,60.485,0,28.271,63.63,60.485,56.653,19.475,53.256,43.453,-39.3,-16.82,-41.1,33.086,64.08,44.38,19.475,53.891,58.172,56.17,36.921,43.418,55.832,-38.12,64.87,63.98,50.324,46.2,-7.542,10.463,31.22,-21.244,58.354,19.475,20.708,54.135,37.735,37.601,34.094,32.458,0.029,63.88,15.307,16.044,-39.42,60.485,59.363,10.83,-50.964,56.58,30.789,32.884,61.64,20.708,46.206,35.361,49.57,63.63,1.08,63.98,37.77,50.267,46.2,-0.171,-18.1,60.485,40.827,19.85,19.023,19.514,55.641,-7.542,-45.9,40.275,56.552,51.923,20.708,19.475,36.921,63.63,63.63,-41.326,35.139,6.113,20.708,19.514,55.678,58.195,53.321,63.63,64.42,39.02,50.324,37.734,28.271,-39.42,4.658,-13.612,-29.27,40.827,39.704,12.95,52.559,37.125,36.799,38.144,34.094,39.853,56.653,19.475,63.63,64.8,17.37,31.22,13.33,63.63,17.36,19.692,60.485,59.363,40.827,-5.358,-12.83,-9.135,31.593,31.934,14.52,32.884,60.032,58.18,33.361,19.475,41.409,9.83,19.85,39.95,39.853,33.137,34.9,35.361,52.559,52.449,51.498,54.049,55.832,43.572,43.384,63.63,64.87,64.75,-0.677,-77.53,37.87,65.03,19.421,40.827,38.57,-0.171,1.08,4.487,14.809,46.2,56.653,53.256,34.9,36.891,19.03,63.63,-15.42,20.708,0.7,18.57,13.33,-39.42,19.475,56.653,51.923,52.449,-39.3,40.827,-6.52,32.884,32.761,41.98,63.63,63.63,13.33,56.653,19.421,39.661,52.559,20.708,37.77,63.63,-0.677,57.05,40.827,60.485,-16.294,19.08,57.15,4.487,-39.42,63.63,-45.9,10.463,-0.677,28.271,19.475,52.559,54.049,54.135,54.596,51.452,40.659,-7.25,20.708,40.98,43.979,64.8,14.809,44.38,19.03,51.923,53.256,38.144,28.271,65.43,-26.789,13.33,63.98,-52.33,40.827,37.734,46.2,19.475,60.485,54.049,40.73,32.884,14.809,38.57,19.023,19.514,13.33,64.8,-18.1,-39.3,41.611,40.821,63.63,14.809,40.827,19.692,33.086,35.361,33.137,52.559,54.135,39.7,-39.3,30.789,-0.53,63.98,14.809,16.72,19.82,20.708,63.63,-0.353,56.653,19.03,53.256,40.827,-38.82,-1.464,38.73,53.256,56.653,19.82,63.63,64.75,0.308,1.5,12.242,12.422,41.409,46.853,56.88,55.424,33.137,34.724,35.361,36.155,36.406,36.227,32.884,43.42,20.708,40.827,1.22,-38.82,38.144,37.647,-50.33,56.653,32.761,-0.677,4.487,28.271,31.934,38.404,52.22,46.206,53.256,52.63,43.418,14.809,63.92,56.28,32.333,63.63,31.22,-39.3,-21.244,40.73,54.761,39.853,33.137,14.501,32.761,0.7,19.85,19.82,19.475,56.653,46.853,37.735,36.891,52.559,55.972,-63.001,63.98,19.692,19.03,54.489,43.57,19.514,43.664,43.572,35.361,-21.244,-38.82,10.463,60.485,33.361,55.678,42.93,19.421,40.659,54.489,51.498,-38.82,-39.3,32.884,63.63,28.271,60.485,40.827,-38.82,-37.77,31.593,56.653,52.449,53.256,34.094,36.891,-7.542,60.485,63.63,-18.1,-77.53,63.98,46.206,39.853,53.256,54.596,15.32,0,64.8,48.17,37.5,-39.42,37.77,51.844,37.735,15.32,39.73,-37.77,42.67,14.809,19.514,60.485,56.653,9.83,19.4,44.43,41.409,36.795,35.361,39.853,39.964,51.577,53.589,51.452,49.57,43.384,15.32,40.73,37.734,-8.25,31.593,31.934,12.77,12.12,37.87,28.271,65.73,39.284,-38.82,20.708,18.78,13.257,-42.833,33.086,-38.82,14.809,1.22,-6.52,60.485,48.112,50.267,54.65,-38.82,60.485,19.514,63.63,10.463,0,56.653,43.664,54.049,53.256,36.571,-16.82,0,-63.001,64.08,14.809,-40.59,-39.3,30.789,39.853,54.596,61.299,19.475,46.206,43.5,33.78,19.514,63.63,-0.677,14.809,19.421,16.044,64.6,10.463,63.98,19.475,19.514,33.137,38.144,19.82,63.63,63.63,37.734,37.444,53.256,-38.82,14.809,18.57,56.58,58.13,54.049,52.559,36.891,36.406,63.98,28.271,12.595,30.443,63.63,-0.353,-15.78,47.95,56.653,53.256,52.543,54.135,38.57,-0.171,4.658,64.03,14.809,13.658,37.734,19.514,63.63,-16.294,0,28.271,38.961,0,64.42,4.818,64.75,35.139,36.155,54.596,52.823,52.559,43.384,42.827,43.572,43.608,46.206,57.97,44.08,48.112,38.404,-12.83,15.13,31.934,14.002,40.73,-38.12,-16.82,52.559,60.485,19.514,38.87,32.884,63.63,64.03,60.485,46.853,53.891,56.653,52.449,34.724,-36.863,63.63,19.82,60.485,35.361,35.233,36.891,53.256,19.023,63.63,-41.874,-39.42,60.485,-52.33,0.468,64.03,64.08,63.98,28.271,51.944,19.475,36.618,34.724,39.853,33.086,53.256,63.63,63.88,4.487,46.206,57.05,63.63,14.809,46.853,58.608,52.22,37.88,53.98,37.601,38.144,50.267,40.73,-0.677,-45.9,60.485,41.805,52.559,36.155,64.03,10.463,0,-8.25,19.15,63.63,14.809,63.43,10.2,63.98,52.559,56.056,28.271,0,65.43,64.03,63.88,36.891,34.724,42.7,-38.82,-5.576,60.485,0,-16.294,0,37.78,45.775,38.789,-12.83,-0.904,32.761,61.299,52.315,9.83,37.692,37.02,46.206,41.409,-25.37,40.656,55.131,52.449,53.256,51.356,51.57,28.57,-77.53,65.73,65.43,63.98,11.984,64.03,64.8,16.72,38.654,58.608,63.63,43.42,7.382,25.17,-38.82,51.844,33.874,36.406,19.514,63.98,35.361,-1.464,19.85,59.363,54.134,38.144,37.735,36.799,40.51,52.559,54.049,-6.52,37.734,15.32,63.98,12.242,64.63,28.271,53.256,63.63,-40.59,63.63,63.98,53.256,34.724,56.653,57.33,19.08,43.42,19.475,38.789,64.03,63.43,63.63,5.091,-41.326,37.647,36.891,52.559,-18.166,38.654,53.256,52.559,42.063,37.125,39.853,34.397,56.653,30.789,31.934,-0.677,63.98,-30.21,60.485,63.63,0,12.12,64.63,58.195,56.653,38.729,53.256,19.692,0,63.63,19.514,36.77,0,64.03,-40.59,10.463,-14.2,43.722,52.559,55.131,54.596,54.32,39.853,34.724,12.595,53.256,-40.59,19.68,33.086,52.559,54.135,42.063,19.514,44.674,64.03,32.73,14.809,60.485,40.028,56.653,55.55,48.777,46.206,43.384,51.356,43.844,55.832,52.449,51.844,51.498,53.256,37.735,34.52,36.77,38.789,64.8,63.43,63.98,63.92,37.77,-77.53,64.63,64.42,0,37.77,36.9,0,64.63,52.559,42.063,43.42,42.544,63.63,38.654,-18.1,28,28.271,63.98,52.559,52.449,54.135,37.601,33.137,19.421,63.63,28,0,-40.59,43.722,19.03,-7.542,-38.82,56.58,51.923,36.406,52.449,52.559,63.98,35.361,15.132,15.255,-45.9,63.98,63.63,36.891,52.559,51.844,20.708,43.722,27.73,64.63,0.038,4.818,-16.82,38.789,31.593,0,63.63,60.485,42.67,38.654,-8.95,46.853,54.596,39.853,63.92,-0.171,50.267,43.722,63.63,-36.193,28.57,60.485,56.653,42.88,51.844,39.853,34.724,-43.189,38.654,45.374,-4.12,52.559,63.98,-45.9,43.722,19.514,60.485,0,64.63,64.65,64.08,52.449,36.155,-44.7,63.63,33.137,-41.326,63.63,63.88,63.98,63.92,-39.25,10.748,33.874,37.601,52.449,53.321,53.589,54.596,54.135,55.972,60.032,46.853,55.42,9.83,18.92,-25.37,-5.33,38.789,1.15,31.22,-36.422,10.463,-37.28,43.722,35.361,63.63,-35.223,-40.59,38.654,-38.82,52.315,61.299,-39.3,37.734,46.206,19.82,19.023,52.559,-23.37,63.98,38.654,4.658,63.63,52.7,51.844,52.928,-16.82,63.63,12.12,60.485,38.654,15.32,56.88,42.93,52.449,54.596,-24.396,28.271,50.267,43.722,-7.942,0,-38.692,63.93,-37.77,52.559,56.47,4.658,38.654,50.267,52.449,39.958,46.853,19.475,35.951,12.12,63.63,-16.294,5.203,31.593,55.678,56.653,37.735,-1.464,59.363,34.724,52.449,52.559,53.256,54.596,55.832,54.135,63.63,63.63,43.42,-18.1,4.818,-42.793,14.809,56.653,54.761,53.256,53.98,52.559,38.144,0,35.361,37.125,34.724,40.51,49.57,49.35,43.572,46.853,36.358,42.93,38.789,-38.12,-39.28,28.271,-76.28,-52.082,63.63,64.08,0.258,63.63,19.231,60.485,10.2,51.844,53.256,55.832,38.144,43.1,36.77,63.63,19.475,52.33,55.678,39.853,55.832,52.559,42.93,54.761,51.498,53.256,54.5,51.452,37.735,31.934,63.63,63.63,15.132,63.63,38.654,25.23,45.88,54.5,54.135,28.271,65.73,45.775,41.805,43.608,54.528,55.131,54.596,52.449,43.979,38.789,14.809,-41.326,-0.677,38.48,60.485,45.179,19.08,-18.166,63.63,64.75,63.98,19.475,57.751,55.678,54.135,-3.25,-37.77,12.595,20.708,19.231,19.514,0,63.63,43.42,42.93,52.449,60.485,-16.82,60.485,15.132,19.85,60.485,52.559,39.761,34.397,31.593,63.63,-8.95,53.256,56.28,0,63.93,56.653,52.449,54.596,35.233,45.775,20.708,-43.189,64.8,63.63,63.43,63.92,10.135,28.57,41.409,44.43,60.485,61.299,35.361,37.125,36.955,34.724,55.832,51.577,52.559,38.789,1.15,-0.2,-0.904,-19,15.32,-39.3,-37.28,31.593,-38.12,53.256,56.653,53.891,45.88,19.231,36.77,17.478,65.73,55.678,60.485,54.135,39.761,37.647,63.63,60.485,37.734,31.771,56.653,63.63,-0.171,28.271,56.28,38.654,19.03,20.708,14.809,63.63,38.57,35.361,40.51,54.596,19.475,45.93,19.023,45.775,31.771,64.03,-76.28,36.618,0,60.485,39.853,53.905,40.827,-0.171,-41.326,53.43,19.231,50.324,19.514,0,-39.637,56.653,54.596,39.761,37.601,38.404,31.593,0,63.63,56.653,0,-0.171,56.653,54.761,36.406,55.131,51.45,39.853,34.094,37.5,33.197,-6.75,16.044,14.809,0,38.654,0,19.85,40.827,56.653,65.73,17.36,5.203,57.72,57.751,19.475,34.724,36.155,36.618,42.544,54.596,53.905,53.83,45.775,38.404,1.5,1.98,28.271,0,-16.82,35.361,-7.2,54.049,56.653,-15.78,14.809,0,-43.189,-43.497,-0.171,0.552,64.63,53.891,19.475,41.409,37.647,34.724,40.827,-42.833,4.892,56.113,41.805,-39.42,20.708,19.231,19.03,38.73,0,37.77,-63.001,37.88,29.968,20.708,-41.326,0,65.88,65.73,56.653,54.32,19.692,-37.856,56.58,34.5,-16.355,65.73,28.271,-38.692,38.52,19.231,-36.863,-35.142,-0.353,47.95,40.821,-6.52,55.678,54.135,42.688,64.6,65.73,0,37.631,56.653,-39.3,-0.171,45.775,15.13,19.03,18.92,46.206,57.27,56.78,54.756,43.384,49.57,55.972,51.577,36.155,39.95,31.934,36.77,1.15,-38.42,1.22,64.87,14.809,64.65,64.63,-76.28,-77.53,38.654,39.761,54.761,64.63,64.08,-19,-4.649,0,56.653,19.475,19.023,34.724,33.086,-16.294,36.406,-0.914,20.708,60.485,0,57.05,-43.497,-23.37,41.409,36.106,40.51,52.559,54.596,10.025,28.271,60.485,-39.3,56.28,56.653,52.315,51.923,36.571,12.12,64.08,35.361,-7.542,14.809,-39.3,19.08,19.85,41.409,44.133,19.475,-0.2,19.08,60.485,58.195,-52.33,65.73,56.653,44.43,52.559,-38.692,8.808,41.409,19.514,54.65,60.485,12.12,-52.33,20.708,47.52,36.227,37.601,15.13,44.608,16.044,-1.464,56.653,-6.77,-5.576,-39.42,19.03,35.361,19.692,19.475,56.653,57.55,54.756,36.155,49.57,51.45,52.449,53.905,54.135,56.113,0.92,40.73,64.08,63.43,64.6,28.271,-41.326,50.324,-38.12,20.708,38.654,40.827,-39.28,54.8,56.653,55.832,38.144,54.134,10.2,0,0,56.653,41.409,34.724,33.137,-39.3,0,-0.677,19.514,56.653,36.106,2.32,0,45.775,19.73,41.409,56.653,31.593,-1.467,-16.608,-42.833,14.809,64.03,-37.406,38.654,60.485,46.853,4.658,38.57,35.361,0,45.775,-39.28,37.125,39.761,48.777,56.653,51.944,19.475,65.73,0,-18.1,39.958,51.844,10.2,19.08,-41.326,0,20.708,56.653,0,0,40.827,-41.326,63.88,-45.9,-6.77,33.137,0,0,39.48,-16.82,-38.12,1.5,-1.506,-8.875,32.884,34.219,34.724,40.656,37.647,34.9,53.83,52.7,55.131,54.596,42.491,46.853,19.475,41.409,-77.53,63.43,-0.375,16.72,31.593,12.278,49.85,0,56.653,-41.326,0,-38.82,0,0,64.08,56.653,14.809,-41.326,0,64.42,0,64.08,-0.83,54.761,40.51,-8.989,43.42,39.761,50.17,-41.326,64.08,-76.05,56.653,43.183,-42.793,56.653,34.724,64.8,-41.326,40.827,56.653,63.93,65.73,50.324,35.361,37.125,-16.355,64.75,58.195,34.8,43.42,50.17,37.5,-7.542,39.761,65.03,63.92,43.42,33.086,43.722,-38.82,-38.82,-39.637,8.808,60.485,-39.157,50.324,15.132,-39.157,-38.82,40.51,54.761,65.88,30.443,36.762,-39.157,-39.28,-39.28,-39.157,38.654,43.42,1.358],[124.05,155.565,-83.767,-88.269,-71.377,124.737,-86.161,15.004,-86.54,123.132,100.473,112.95,-67.73,116.47,-83.767,-71.183,155.565,-26.46,-86.845,131.104,124.792,160.642,-78.436,-61.64,127.33,-71.85,124.13,139.021,138.523,-169.944,-87.004,130.217,-91.35,124.792,-86.845,124.05,-130,-75.324,-72.614,-78.442,-70.903,-83.767,155.461,55.708,114.042,-88.269,159.443,124.737,160.642,-175.382,127.33,-75.324,-71.93,-24.35,-161.894,154.175,-83.767,122.775,137.48,-85.324,145.037,131.104,-17.53,-71.85,123.685,130.217,152.203,-71.183,55.708,125.4,159.15,-161.894,119.07,29.2,145.03,105.423,145.964,110.442,109.208,112.308,125.4,-163.97,-87.004,100.473,157.95,131.104,114.042,-88.269,-169.944,140.874,110.442,159.15,93.858,107.6,42.18,98.392,15.004,123.57,160.642,-71.93,151.33,-70.903,-159.38,153.48,-87.004,130.308,-83.767,-161.894,123.685,-67.73,-90.601,107.6,93.858,147.871,144.506,145.964,152.203,-103.62,-87.004,-71.183,148.42,160.326,175.632,150.875,151.33,145.8,121.708,155.565,100.473,124.792,127.33,-87.004,73.513,160.642,147.871,124.737,177.18,175.632,-177.188,-179.033,-26.46,125.4,-77.37,124.13,151.33,150.516,100.473,-75.324,-85.324,-177.168,141.289,145.964,-83.767,123.505,42.18,127.33,29.2,-72.97,-18.03,167.5,-87.004,-85.324,100.473,105.423,-169.944,124.737,35.914,41.7,167.83,-72.117,-17.33,131.104,-86.845,145.8,-130,160.642,152.203,125.4,124.792,-70.568,130.862,-83.767,40.3,112.95,-78.442,-26.46,160.32,124.05,110.442,105.423,55.708,93.858,-70.568,98.392,15.004,-77.37,145.037,125.4,152.203,156.014,153.93,-87.004,158.03,-169.944,145.78,151.33,160.595,145.8,139.526,15.004,130.862,-19.62,141.481,67.492,-83.767,29.2,-78.442,160.595,-85.622,-71.93,130.862,55.708,-84.233,-169.944,167.5,109.92,123.685,-87.004,148.42,160.642,40.82,-169.944,153.2,116.47,109.208,-91.55,139.526,101.264,105.423,-175.382,-152.742,156.014,-71.93,138.523,109.92,-84.233,-169.944,103.13,158.712,125.4,-87.004,144.013,40.553,-174.23,-173.75,-76.03,-71.93,-26.46,-77.37,160.642,55.708,165.8,130.862,123.685,138.523,-175.508,-85.622,155.461,-77.656,150.027,-168.13,160.595,-86.845,-87.004,114.042,124.737,-91.408,168.12,93.858,15.004,139.526,-72.646,-86.161,122.455,127.63,101.264,150.027,-159.38,131.104,-177.188,-84.233,-26.46,139.526,-76.03,-71.729,178.478,100.679,145.67,-85.622,-87.004,-86.845,105.423,-77.37,112.308,41.83,175.57,101.264,150.516,155.461,-161.894,40.82,114.042,127.53,-169.944,124.737,35.914,-71.729,148.115,160.595,151.33,168.346,157.95,137.48,15.004,100.679,-77.656,155.461,-76.03,160.642,-85.622,123.579,43.38,124.737,-177.188,-86.845,145.8,29.2,-174.166,168.12,148.115,124.05,175.57,103.13,-84.233,-153.672,100.679,-85.622,139.526,152.203,148.42,-174.775,-86.845,-86.161,55.708,15.004,123.685,125.4,-26.46,123.132,43.38,-67.73,160.595,-70.903,-84.233,144.013,124.05,145.67,-177.92,73.513,-159.38,151.33,110.442,123.685,139.526,-169.944,165.8,124.737,124.42,15.004,-153.43,160.595,167.83,43.38,-77.37,-87.004,168.346,-91.17,150.027,55.708,-26.46,40.48,-159.38,123.685,-104.3,-85.622,72.6,141.481,-89.63,93.858,-91.55,-67.73,148.42,124.737,43.38,-62.18,131.104,100.679,139.526,151.33,-169.944,155.461,-86.161,-177.188,-174.166,55.708,122.455,168.346,156.014,152.203,123.132,160.642,-98.622,-159.38,-87.004,139.526,148.42,-77.656,-86.845,-17.33,145.037,129.714,124.737,116.47,-122.18,160.642,15.004,138.523,168.346,100.473,-71.93,-12.48,153.48,-90.601,-77.37,-174.166,122.455,37.75,101.264,112.95,123.685,125.5,-98.622,29.2,55.708,127.63,151.33,145.67,125.4,-86.845,-175.07,157.95,130.308,-62.18,142.686,-163.97,-159.38,168.37,15.004,122.455,148.42,131.104,160.595,145.037,-86.161,124.792,-71.377,127.33,-71.85,160.595,131.104,109.92,122.833,-87.004,73.513,168.346,55.708,122.775,-71.93,145.037,145.67,-26.46,-103.58,155.461,151.33,-177.188,-71.729,-169.058,123.685,15.004,123.132,138.523,130.308,144.775,160.595,124.792,123.132,160.642,55.708,107.73,-77.656,-177.188,145.037,15.004,-67.73,-86.845,-71.729,122.775,123.685,-78.598,152.203,125.37,-159.38,151.33,140.303,150.516,-144.017,29.2,-174.166,-26.46,-77.37,114.042,-90.601,-87.004,148.42,-177.188,29.25,130.308,160.642,165.8,-78.598,168.37,124.792,155.461,29.25,-88.269,145.037,55.708,-90.88,160.595,-61.64,15.004,-78.598,-5.22,159.443,-90.601,158.836,-26.33,-174.365,100.679,141.289,-26.46,151.33,160.595,105.423,15.004,145.037,55.708,168.346,127.63,101.264,-87.004,72.6,145.03,-86.161,100.473,55.708,177.18,29.2,-169.944,-86.845,151.33,120.98,139.526,123.685,96.329,129.714,112.95,165.8,130.308,151.33,140.677,102.62,-90.601,-26.46,160.642,-67.73,160.595,123.685,114.042,-71.183,158.196,139.526,55.708,145.037,105.423,9.17,124.737,124.792,-71.85,140.839,-77.37,158.196,160.595,100.473,73.513,177.18,155.196,-19.7,129.714,55.708,160.642,29.2,130.308,-85.622,-86.161,157.95,151.33,148.838,-78.442,141.289,161.36,-86.702,114.042,55.708,114.242,123.685,129.714,-177.188,123.57,-90.88,-86.845,-144.017,109.208,-87.004,165.8,85.25,161.36,100.473,122.775,9.17,115.375,-163.97,96.329,101.264,125.4,160.595,160.642,105.423,168.37,157.95,-175.53,129.714,127.63,-17.33,-27.32,-70.568,-71.729,144.013,-163.97,101.264,140.677,29.2,-91.408,-86.161,177.18,-156.99,-78.598,160.642,125.4,101.264,115.375,168.346,160.595,161.36,-174.166,130.308,96.329,-71.729,138.036,177.18,55.708,-71.93,-85.324,-130,-88.269,-177.188,160.595,-103.62,138.036,175.57,160.642,140.757,-61.305,-86.161,-163.97,-87.004,140.757,160.595,-169.944,-26.46,-177.188,114.042,161.36,-171.252,105.423,-78.598,-71.729,-168.13,157.95,119.07,130.308,109.92,129.714,-86.161,155.565,29.2,72.6,144.013,160.642,-67.73,125.4,-26.46,-17.33,-177.188,-171.252,-71.93,-161.894,140.281,123.132,101.264,160.595,105.423,175.57,168.12,-84.233,-98.622,140.677,-126.78,-155.27,170.28,130.299,159.443,159.45,-71.93,145.8,-86.15,127.33,-163.97,77.825,152.203,-177.188,-159.38,125.4,-85.324,-71.729,145.57,131.249,-26.46,112.95,-68.55,-71.183,160.595,-62.18,177.18,-177.168,-174.87,-86.702,-159.38,-71.93,-24.35,-26.46,112.95,167.83,114.042,137.587,-166.923,-91.55,-88.269,175.57,-169.058,165.8,-98.622,93.858,-83.852,-71.183,168.12,124.05,-67.73,-169.944,103.13,-71.93,152.203,35.914,160.642,141.289,115.375,-86.845,-103.62,-67.73,114.042,160.595,29.2,29.25,15.004,116.47,-169.944,-71.729,131.104,151.33,105.423,-84.233,114.242,-177.168,127.33,-67.73,-91.12,147.12,160.595,123.57,-163.97,123.132,15.004,-166.923,-159.38,114.242,-129.58,-86.161,123.258,-172.51,127.33,114.042,-78.598,15.004,123.685,120.35,-67.73,-110.95,109.92,145.8,-77.37,151.33,73.513,-172.51,-165.986,72.6,141.481,105.423,-84.233,160.642,-71.93,55.708,-71.729,-71.183,120.35,-168.03,-152.251,123.132,73.513,131.104,145.8,-86.702,125.5,160.595,-165.986,175.57,-84.233,160.642,110.442,123.132,15.004,130.862,-104.3,-164.65,123.258,-67.73,-90.47,29.2,-165.986,114.042,-71.93,-72.97,55.708,43.38,175.57,125.4,-174.87,124.737,124.792,137.48,122.775,123.258,-85.324,157.95,-91.55,160.642,120.35,93.858,-84.233,-103.62,-104.3,120.52,123.132,-70.568,-19.7,158.836,156.014,96.329,101.264,-67.73,130.299,-122.18,139.394,-165.986,168.12,138.523,175.57,177.602,-177.188,-71.85,127.33,-78.598,129.714,-61.64,-161.894,-71.729,112.308,160.595,122.775,-165.986,55.708,114.042,161.36,175.57,-77.37,-90.601,-113.206,-72.117,15.004,-152.742,-122.18,123.132,145.1,15.004,-178.794,160.595,165.8,139.098,175.57,125.4,9.17,147.871,29.2,168.12,124.737,138.036,161.36,131.104,-165.986,-86.161,-77.37,156.014,153.2,151.33,-61.64,-71.58,142.686,175.57,161.36,-73.28,15.004,-91.55,-177.188,145.8,127.4,109.208,-71.85,123.132,-175.382,-85.622,131.104,129.881,124.792,-165.986,175.57,124.05,105.423,127.33,168.12,130.308,144.013,129.714,-104.3,29.2,120.52,-69.797,139.394,-67.73,-86.845,156.014,123.258,145.8,-171.252,-178.794,175.57,141.481,-103.62,-169.944,-140.25,-84.233,114.042,138.036,179.58,127.53,-85.324,123.132,-159.38,-159.797,15.004,-174.166,-166.923,-86.161,-165.986,100.473,-90.88,-85.324,160.595,-71.85,160.642,-168.13,155.461,139.394,168.12,15.004,153.48,110.442,-67.73,153.2,109.92,-130.3,29.2,99.539,157.95,178.478,160.642,123.132,-177.188,123.258,155.565,-140.25,-169.944,-161.894,161.36,-153.43,160.595,124.792,-163.97,-165.986,15.004,175.57,177.18,-92.109,-69.797,141.481,-129.58,96.329,15.004,157.95,-85.622,151.33,175.57,-88.269,123.132,-75.324,129.714,-85.324,114.042,160.642,119.07,142.686,55.708,160.595,161.36,175.57,124.737,-78.598,-175.63,123.132,15.004,121.708,73.513,-148.821,-8.146,-71.409,-103.62,151.33,-75.324,-85.622,-67.73,-159.38,100.473,175.57,129.714,123.685,-16.78,151.33,-71.93,158.03,15.004,-169.944,165.8,124.737,112.95,121.708,144.013,15.004,-71.729,131.104,175.57,-85.324,-91.55,-155.608,161.36,160.642,140.933,-174.775,29.2,160.595,108.058,168.12,177.18,112.95,-148.821,55.708,-161.894,151.33,-140.25,-71.93,139.526,107.6,123.57,127.33,138.528,121.601,-148.821,-161.894,-168.13,131.104,124.05,-159.38,-17.33,123.258,125.4,138.036,138.523,15.004,-85.622,-140.25,-85.324,-155.287,35.914,168.12,100.473,100.473,141.289,150.875,123.258,138.528,168.346,9.17,160.642,-165.986,138.523,-155.287,-91.35,124.737,114.042,29.25,-177.188,-155.287,138.523,167.5,157.95,108.058,155.565,-93.228,160.642,-148.821,100.473,141.289,-140.25,-178.794,-85.622,-130.3,125.4,29.2,15.004,155.565,-86.845,-16.78,175.57,-161.894,-78.598,-91.55,167.5,131.104,160.595,146.252,145.8,176.5,155.565,105.423,124.05,-19.7,-161.894,-168.13,15.004,127.53,-84.233,141.38,168.12,55.708,-86.845,-16.78,15.004,160.642,109.92,-84.233,-140.25,-161.894,121.708,175.57,157.95,151.33,-71.45,130.217,131.104,-84.233,127.33,37.75,161.36,160.595,-19.7,123.132,-178.794,15.004,-161.894,-165.986,-71.93,158.03,112.95,153.93,168.12,-166.923,160.595,168.346,100.473,-122.18,125.4,-16.78,105.423,141.289,-155.287,-140.25,29.2,175.57,-69.797,-177.188,167.5,124.05,-155.287,-91.17,137.48,-71.729,-140.25,160.595,-84.233,15.004,105.423,15.004,168.346,175.57,168.12,131.104,125.4,55.708,-173.67,-174.87,-72.07,-61.18,153.48,-73.48,-73.55,109.92,130.862,160.595,-163.97,-177.188,-91.408,168.12,145.964,168.37,96.329,141.38,141.289,168.346,42.47,-165.986,-84.233,160.595,-91.55,124.05,146.252,105.423,123.132,157.95,-73.55,141.38,151.33,15.004,-85.622,123.685,176.5,125.4,-163.97,-164.65,-177.188,122.202,114.042,-84.233,-140.25,140.244,-103.62,124.865,-61.64,55.708,-177.188,-87.004,120.993,-155.287,-90.88,140.839,160.642,168.12,157.95,175.57,175.632,114.042,-84.233,-16.78,167.5,131.104,43.38,-85.622,-177.188,-156.51,160.595,55.708,-91.55,-76.4,-172.51,-90.88,-83.852,157.95,-71.93,168.12,-61.64,29.25,29.2,177.18,-88.269,-86.845,55.708,-165.986,153.2,125.4,175.57,120.993,-87.004,157.95,175.632,-61.664,-84.233,114.042,168.346,130.217,160.595,-87.004,175.57,138.528,-153.43,167.5,-77.656,147.12,-163.97,141.289,-130,-16.78,-103.62,-155.287,55.708,124.792,175.57,140.303,131.104,-163.97,-161.894,141.935,157.95,-155.608,160.326,-90.88,-86.845,175.57,105.423,168.346,114.042,15.004,175.632,100.473,-27.186,-155.287,145.964,141.481,157.95,148.115,-90.88,15.004,-155.287,-84.233,177.18,-61.64,-161.894,138.036,-155.287,-155.1,114.042,130.217,160.642,-161.894,115.375,145.037,140.049,139.394,103.13,-176.13,145.964,-165.986,168.536,15.004,168.346,-77.37,-85.622,141.481,-91.55,123.57,-161.894,-155.287,130.217,-77.656,175.57,121.708,178.478,167.5,151.33,143.47,124.792,-174.166,155.461,109.208,150.05,100.473,146.252,-173.67,-169.058,-71.377,147.871,55.708,-155.287,114.042,168.12,140.874,147.12,123.258,-165.986,148.42,-90.88,176.5,138.523,103.13,-20.28,-8.146,124.737,131.104,147.871,115.375,167.17,175.632,-90.876,157.95,175.57,121.708,148.115,110.442,43.38,130.217,-72.614,-61.64,-148.586,-77.656,-86.15,155.565,105.423,55.708,-91.55,151.28,168.12,175.632,-84.233,112.95,115.375,147.78,167.17,125.4,155.196,-73.55,-71.729,160.642,109.992,-71.93,-17.83,-153.43,-61.18,-155.287,15.004,-90.88,114.042,165.8,-148.586,-155.287,-72.97,130.862,177.18,-156.99,160.642,124.737,167.5,124.792,-87.004,177.18,15.004,139.394,175.57,29.2,115.375,160.595,168.536,168.12,-86.702,148.42,122.775,125.4,120.993,140.799,-8.146,175.57,160.326,-85.324,-60.652,100.473,-84.233,177.18,139.394,-148.525,123.132,160.642,155.196,148.42,159.443,168.346,-19.7,131.104,-88.269,124.737,150.05,139.918,139.394,151.33,115.375,160.326,147.871,178.478,99.539,122.775,124.13,-86.702,141.289,124.792,120.993,157.95,123.132,148.42,167.5,-85.324,177.602,160.642,-144.017,177.18,107.6,109.208,175.57,-70.903,-155.287,-67.73,-84.233,-85.324,-148.525,122.202,145.1,121.18,-155.287,-60.652,-86.845,156.014,121.645,175.632,139.394,141.289,101.264,130.217,122.775,-155.1,-86.702,-155.287,100.679,143.47,-155.287,175.632,155.196,-84.703,139.394,128.223,160.642,124.737,-91.55,121.82,-16.72,-91.55,129.5,123.685,175.57,147.12,101.264,147.871,120.993,177.18,115.375,139.394,100.679,15.004,167.5,160.326,-84.233,-69.797,141.289,-174.87,112.308,-152.742,-60.652,125.4,128.223,-155.287,101.264,159.443,100.679,160.326,155.461,-155.1,112.92,120.993,-70.761,175.57,35.914,167.5,168.12,107.6,-140.25,109.208,131.104,139.394,29.2,-90.88,100.473,144.896,160.326,112.308,-163.97,168.346,151.33,148.42,110.442,-88.269,-84.233,156.014,160.642,118,40.67,130.217,177.18,-85.324,-89.633,-152.742,124.792,125.5,-90.88,120.993,-88.269,144.013,101.264,-86.845,124.737,-61.64,115.375,112.308,145.57,160.326,175.57,116.47,155.196,157.95,55.708,-161.894,-148.586,100.473,119.07,-88.269,-90.88,-152.742,15.004,167.5,109.208,-155.1,-155.287,157.95,153.2,139.394,165.8,140.303,124.13,-61.64,-86.161,107.6,120.993,167.5,116.47,115.375,167.47,156.014,160.642,43.38,124.792,-90.601,-88.269,138.523,144.013,159.443,124.13,125.4,160.595,-155.287,107.6,-86.845,-113.206,160.326,105.423,145.037,160.595,-84.233,55.708,109.92,148.42,-177.92,161.36,-88.269,131.104,-69.797,101.264,160.595,144.013,-155.1,131.104,55.708,155.196,177.602,-164.65,-71.93,160.326,129.5,103.13,124.13,155.461,168.12,119.07,-107.95,-71.729,121.708,-163.97,124.792,157.95,145.037,139.963,160.642,131.104,-20.28,55.708,167.17,-155.1,-153.43,-155.287,-90.88,167.5,168.63,115.375,168.12,-155.287,138.036,168.346,101.264,-84.233,-85.622,160.595,131.104,-91.17,-155.1,151.33,-83.852,156.014,-91.35,-86.702,-71.93,115.508,138.036,-171.252,145.037,178.478,100.679,-103.62,127.33,177.18,-155.287,-165.986,160.595,139.526,-90.88,160.326,168.346,167.5,142.686,137.587,-155.1,-85.622,175.632,144.013,145.037,124.792,-86.702,138.036,-28.246,148.42,155.196,125.4,177.602,139.394,157.95,-86.845,-70.568,-16.75,-86.702,160.595,-12.28,125.4,-73.55,-155.287,138.523,168.12,142.686,155.196,107.6,-155.287,145.037,-155.1,160.595,124.792,-69.797,155.461,110.442,55.708,157.95,160.595,160.326,-91.55,-90.601,-155.287,125.4,-155.287,-72.614,158.03,-103.62,-71.183,-71.93,148.42,-68.4,-69.092,109.208,160.642,158.196,150.875,-168.13,139.963,-86.702,152.475,168.12,144.013,131.104,153.2,151.33,139.918,-69.797,-70.568,168.346,168.37,101.264,-77.656,-72.117,144.818,160.595,159.443,124.13,35.914,-155.287,55.708,40.67,131.104,-161.894,129.714,-69.895,-71.183,-73.55,177.18,145.037,105.423,-155.287,-70.568,-67.73,15.004,-69.797,160.595,139.394,168.536,142.686,143.71,-69.092,131.104,-91.408,128.223,175.632,145.037,175.57,144.013,144.818,168.12,-69.797,15.004,55.708,130.862,9.17,160.642,139.394,139.918,160.326,159.15,155.196,-69.895,-16.72,-175.07,138.528,160.595,177.18,157.95,168.12,-71.93,175.632,15.004,-77.656,100.473,168.536,142.686,138.523,105.423,109.208,144.818,168.37,-91.55,-168.13,29.2,160.326,124.865,178.478,100.473,55.708,155.461,160.595,160.642,-161.894,148.42,109.208,139.394,144.818,144.013,124.792,35.914,151.33,160.595,-69.797,-84.233,148.838,139.918,119.07,29.2,177.18,151.95,144.818,131.104,153.02,-28.73,-86.702,55.708,168.12,15.004,29.485,139.394,160.595,-174.325,-103.62,139.918,155.461,131.104,141.289,-85.622,106.965,144.013,-90.88,109.208,157.95,15.004,107.6,119.07,140.757,160.642,-155.1,-91.17,-76.4,159.15,131.104,145.037,119.07,158.712,175.57,29.2,129.714,-61.664,-71.93,160.326,-155.1,131.104,109.92,43.38,112.95,142.686,-70.903,106.965,148.42,102.62,144.013,159.443,-159.38,114.042,175.632,-26.587,131.104,139.394,160.642,155.196,171.32,-76.4,112.95,144.013,109.208,160.595,-71.729,130.657,160.326,-72.07,-90.88,131.104,55.708,-163.97,139.918,147.12,148.42,15.004,-155.287,148.42,105.423,35.914,114.042,160.326,177.18,168.12,119.07,159.443,153.48,-77.656,167.17,109.92,141.38,-91.17,139.918,119.07,-86.688,-88.269,171.32,142.686,144.818,100.473,153.2,35.914,9.17,-67.73,-155.287,160.642,131.104,148.42,175.632,141.38,145.037,119.07,73.513,29.2,160.326,-86.702,-17.33,144.013,55.708,168.12,129.714,175.632,138.523,131.104,-161.894,124.737,-61.64,139.963,116.47,139.394,-163.97,105.423,141.38,121.645,-91.17,73.513,109.208,-152.251,147.35,160.642,155.196,124.13,147.12,168.12,131.104,-90.88,145.037,109.92,119.07,105.423,55.708,110.442,-155.361,-155.1,168.37,168.536,114.042,125.4,-165.986,141.417,159.443,-91.12,159.674,175.632,154.7,155.373,159.443,144.896,-86.688,105.423,168.536,139.918,142.686,112.58,168.12,-110.82,127.53,107.6,175.57,139.376,-155.287,138.523,55.708,114.242,157.95,102.62,123.57,-84.233,122.202,155.196,43.38,125.4,-178.794,150.05,101.264,124.865,-166.923,123.505,157.95,160.642,29.2,123.57,-67.73,165.8,-165.986,-161.894,15.004,55.708,112.308,-174.325,144.896,141.38,29.2,-70.903,-155.361,148.019,143.47,-86.845,124.792,-85.622,109.208,-24.35,176.5,80.2,-110.95,131.104,175.632,-163.97,175.57,108.4,109.208,140.757,141.38,148.15,123.258,127.53,-91.408,168.12,157.95,15.004,-86.702,-176.13,131.104,112.58,127.53,100.473,138.523,123.57,55.708,-161.894,112.92,139.394,105.423,-155.1,130.657,175.57,175.632,-155.608,112.95,-26.587,123.258,102.62,55.708,140.244,73.513,140.788,-77.37,25.396,140.757,-104.3,-178.794,-176.13,131.104,-92.109,15.004,15.004,-90.88,100.473,129.714,168.536,125.4,124.792,-71.729,140.757,-17.83,123.258,-155.1,-86.702,-76.4,105.423,160.642,100.473,-70.761,123.57,168.536,138.523,175.632,138.036,123.258,-155.608,125.37,127.53,116.47,171.32,-91.408,155.196,125.4,106.965,109.208,-89.633,-71.93,110.442,168.536,124.673,175.632,-86.161,-91.17,160.642,130.657,-91.408,-86.845,175.57,175.632,123.258,-165.986,43.38,-71.93,131.104,123.57,-86.702,29.2,112.95,55.708,-91.35,-86.845,-85.622,-84.233,-163.97,140.757,125.4,158.03,106.965,124.737,-86.702,138.523,131.104,-76.4,124.13,159.443,-19.7,144.818,15.004,125.4,167.17,15.004,123.685,177.18,160.326,144.896,-98.622,-90.88,55.708,-71.93,131.104,105.423,145.037,-165.986,140.788,175.57,153.2,-84.233,138.523,112.92,160.642,-85.153,-175.63,159.443,-163.97,105.423,-71.729,55.708,-86.161,131.104,150.05,159.443,175.57,-86.845,-76.4,139.918,15.004,112.92,130.657,-71.377,-69.797,130.217,131.104,159.443,159.674,158.196,160.642,112.92,15.004,-168.13,55.708,-71.729,175.57,-176.13,158.836,-73.55,-72.614,155.196,105.423,116.47,160.642,109.92,-90.88,141.289,140.788,161.36,175.57,123.258,141.38,114.042,140.839,-169.944,109.208,55.708,-85.622,-159.38,-77.656,138.523,144.818,105.423,-71.183,-71.729,131.104,-86.845,152.203,109.92,-61.64,109.208,-175.63,149.075,131.104,-168.13,-91.408,155.196,55.708,114.042,-75.33,-101.75,159.443,144.896,105.423,100.473,123.685,147.12,140.677,55.708,124.792,107.73,175.57,130.657,15.004,-71.729,168.12,110.442,-155.608,138.528,105.423,157.95,-98.622,-177.168,114.042,125.4,15.004,112.92,123.685,121.18,-71.729,152.203,130.657,144.896,105.423,151.33,138.528,55.708,-84.233,129.714,160.326,175.632,139.394,35.914,139.526,103.13,125.4,-86.845,140.44,112.95,130.657,131.104,138.528,-155.608,103.67,175.57,109.208,125.4,152.203,160.326,159.15,159.443,150.05,40.67,114.042,-67.73,-91.408,-78.436,103.13,122.775,110.442,109.208,102.62,168.346,-159.38,-86.845,130.657,109.92,124.535,160.326,139.394,123.685,25.396,140.303,175.632,-61.64,103.13,112.95,137.587,-174.325,-159.38,-83.852,-88.269,158.196,157.95,106.7,109.208,168.346,-78.436,138.528,139.394,-89.633,155.196,-86.845,144.896,-16.75,55.708,-71.93,-71.729,106.7,158.196,159.443,-166.923,127.33,-70.568,114.042,154.808,139.394,55.708,138.528,105.423,123.685,155.196,121.82,121.18,-17.33,138.523,129.714,158.836,130.657,-68.4,106.73,29.2,101.264,131.104,121.601,147.12,168.12,-168.13,-169.944,-91.35,138.528,-170.629,-86.845,114.042,101.264,155.196,55.708,105.423,139.394,108.4,-72.027,-70.903,152.203,131.104,160.642,-70.568,168.12,140.677,-91.55,-71.729,131.104,175.632,-175.382,96.821,44.67,109.208,-89.633,-71.183,-26.587,103.13,141.38,114.242,106.7,105.423,55.708,145.037,101.264,-77.656,114.042,160.326,131.104,-77.938,-175.42,175.57,101.264,141.38,144.896,-77.37,131.104,-161.894,-140.25,-26.587,-175.63,-71.93,122.775,145.161,-155.608,130.657,137.587,168.12,125.4,15.004,-71.377,112.95,106.7,139.394,160.642,-153.43,106.73,-85.622,-91.35,131.104,105.423,55.708,141.289,-17.33,175.57,175.632,138.523,159.443,156.014,130.308,-155.287,175.57,-78.341,131.104,144.896,124.13,175.632,138.523,139.918,139.394,-17.33,-72.117,15.213,103.13,-71.377,138.523,15.004,-86.845,138.528,124.05,130.217,-155.608,141.38,-89.633,-17.33,114.042,155.565,127.33,-176.13,139.394,-67.73,110.442,159.443,127.894,104.27,150.516,110.1,55.708,109.208,177.18,-175.42,-83.852,-73.55,-98.622,138.523,154.508,-71.93,-71.58,-70.761,-91.35,147.12,168.346,-71.729,-175.65,123.132,105.423,127.33,110.442,55.708,-77.37,138.528,144.896,140.799,109.208,-70.75,15.213,131.104,159.443,122.775,129.5,-71.729,137.587,-163.97,160.642,-90.88,-169.944,147.131,100.473,145.037,-72.614,-91.408,-84.233,-155.287,-168.03,141.38,105.423,154.508,160.642,15.004,142.686,-158.17,-165.986,158.03,130.217,138.523,-89.633,137.587,160.642,-168.13,160.326,-88.269,175.632,55.708,-78.436,125.5,110.442,-155.287,15.004,125.4,-83.852,131.104,158.03,124.792,-71.729,-159.38,112.95,55.708,138.523,100.473,109.208,-89.633,177.18,137.587,153.2,125.4,161.36,-88.269,-113.206,141.289,141.284,-71.93,55.708,-169.72,-71.729,138.523,-61.165,158.03,140.757,112.95,15.004,-88.269,-85.622,-175.63,-155.287,168.12,100.473,140.677,109.208,160.642,-163.97,107.6,-165.986,114.042,137.587,-178.794,-161.894,-155.287,-86.702,158.196,138.523,-72.117,-72.614,-86.845,-16.72,-84.233,-77.656,159.15,159.443,106.7,42.2,112.95,144.896,142.686,-71.377,15.004,114.042,131.104,141.38,177.18,139.394,121.708,-163.97,15.004,175.632,124.05,109.92,140.677,109.208,112.95,175.632,153.2,-83.852,161.36,158.196,-85.622,25.396,141.38,142.686,123.685,123.57,43.38,-140.25,-86.845,-90.75,138.528,105.423,137.587,-91.55,160.32,-71.729,-175.42,114.042,-86.845,-155.287,151.33,-71.377,123.132,29.25,138.523,109.208,100.473,137.587,158.196,153.2,-89.633,-163.97,-165.986,123.258,119.07,-71.93,-76.4,-166.923,158.712,175.632,-77.87,109.208,176.5,141.38,125.4,131.104,55.708,115.375,-90.876,-76.4,-16.75,-168.03,-22.5,127.53,103.13,175.632,-155.608,158.836,160.642,107.6,145.037,177.18,-77.656,15.004,40.3,35.914,-103.62,-78.436,-91.55,55.708,-89.633,142.686,175.632,-76.4,25.396,159.443,129.714,-91.35,160.642,100.473,-86.161,145.8,138.528,175.57,131.104,115.375,123.258,145.037,9.17,144.896,159.15,-163.97,-98.622,-84.233,-69.797,-90.876,137.587,121.18,123.93,175.632,-77.37,110.442,138.523,55.708,140.677,-155.287,175.632,55.708,-155.287,125.4,100.331,150.05,-89.633,115.375,-83.852,153.33,153.25,114.042,-161.894,175.632,177.18,176.5,144.818,121.94,152.475,-76.4,-16.75,-77.37,-98.622,124.737,-86.702,15.004,101.264,-155.287,160.642,-175.53,130.862,137.587,15.004,109.208,106.7,103.13,127.33,107.73,109.014,140.677,157.328,159.443,160.533,141.38,145.8,153.2,-16.75,131.104,115.375,8.75,168.536,151.95,-161.894,139.394,160.533,-16.75,-71.729,-71.93,-163.97,-84.703,-17.33,115.375,141.289,168.346,-91.552,125.5,-155.287,140.677,125.4,160.642,-85.324,137.587,110.442,112.95,9.17,145.037,177.18,-178.794,-78.436,36.57,-72.117,129.714,-85.622,55.708,175.57,130.017,159.443,141.38,112.95,101.728,101.264,103.13,-155.287,125.4,-16.75,114.042,125.5,35.914,115.375,122.775,29.2,137.587,-71.93,138.523,112.308,145.037,-89.633,-88.269,110.442,141.38,55.708,168.37,150.516,29.2,29.25,123.505,131.104,137.587,-72.578,-155.287,-88.269,96.821,137.587,130.017,-155.608,145.037,141.001,-86.702,140.677,151.33,112.308,139.394,141.38,121.94,131.104,15.004,138.523,100.473,-98.622,-155.287,106.73,-86.161,-72.117,-16.75,-17.33,15.004,-19.05,124.05,100.473,43.38,127.33,151.33,125.491,108.058,175.57,141.38,121.94,100.473,15.004,-155.287,131.104,110.442,-86.161,-85.622,29.25,176.5,96.329,137.587,124.737,127.53,175.632,-161.894,-83.852,158.196,15.004,100.473,-89.294,99.539,138.523,141.38,55.708,145.67,-72.614,176.5,114.242,114.042,-71.729,-70.352,121.94,145.037,36.57,145.8,137.587,35.914,158.196,114.042,158.196,140.051,-155.608,138.523,100.473,131.104,137.587,-78.442,124.05,-84.233,-75.324,-70.761,100.473,176.5,116.47,112.95,168.12,139.394,167.17,55.708,137.587,138.523,114.042,124.737,151.33,110.442,167.17,176.5,137.587,139.918,160.642,-113.42,159.443,40.573,112.92,-71.93,-155.608,138.523,130.862,-86.702,-84.233,-70.761,175.632,35.914,-161.894,-71.729,100.473,122.775,151.786,100.331,-121.508,-84.233,125.37,139.394,-72.117,176.5,131.104,141.481,130.657,130.217,129.857,-178.146,-71.377,15.004,130.862,168.12,137.587,-155.1,-86.161,55.708,14.426,100.473,112.92,114.042,175.632,-19.7,124.737,125.5,176.5,-103.62,160.642,175.632,144.818,35.914,-68.83,-69.092,167.17,29.2,-175.63,112.92,15.004,-85.324,-154.963,-155.157,-175.382,176.5,119.07,139.394,137.587,-77.656,-70.761,-89.633,159.443,144.896,168.12,-71.729,-69.832,-60.652,-91.17,112.92,-26.67,100.473,124.737,160.642,167.17,15.004,127.33,-68.4,127.63,15.004,29.25,-175.53,137.587,-144.017,167.17,-25.88,119.07,120.993,131.104,127.53,150.516,151.158,-165.986,159.443,-72.614,15.004,139.394,55.708,112.92,124.737,137.587,36.75,175.632,-84.233,160.642,140.839,176.5,-17.53,15.213,121.18,107.6,131.104,15.004,73.513,43.38,-73.4,15.004,-84.233,112.95,175.632,156.52,168.12,36.33,123.57,100.473,-17.33,116.47,-16.641,123.258,112.92,-168.03,-71.93,158.836,165.8,168.12,101.728,160.642,177.18,106.965,29.2,9.17,144.818,55.708,131.104,175.632,-72.614,110.442,138.523,112.95,141.38,122.775,145.037,145.8,-24.35,-103.62,-71.93,176.5,101.264,138.523,155.196,144.818,124.737,15.004,15.004,167.17,-165.986,103.13,138.523,131.104,112.92,110.442,29.2,168.12,168.346,-153.43,159.443,-73.585,-78.436,100.473,112.95,131.104,137.587,55.708,127.33,29.2,144.818,175.632,-86.845,122.775,-85.622,112.95,138.523,160.642,-70.761,112.92,-175.65,124.737,40.573,-78.436,-71.93,-72.614,-72.07,-25.88,29.2,157.572,-69.797,175.632,138.523,-155.608,112.92,102.62,121.94,148.42,35.914,-165.986,-166.923,-174.166,-71.377,-71.729,-70.903,-28.08,-155.287,-175.07,-70.903,112.95,109.992,-78.436,-71.377,124.737,131.104,40.67,-177.168,116.47,-71.93,139.918,138.523,175.57,-168.03,175.632,-174.325,176.5,110.442,-86.161,-175.07,29.25,-161.894,145.406,154.808,-76.4,-70.761,-72.614,-72.578,123.132,100.473,120.98,-69.832,138.528,140.677,112.92,-172.525,29.2,176.5,125.4,-155.287,176.5,55.708,-86.54,110.442,161.36,140.44,103.13,115.375,29.25,175.632,-78.436,-72.117,-57.93,175.632,141.481,145.037,124.865,125.491,55.708,151.158,138.523,109.208,129.144,-86.161,145.037,125.37,100.473,125.491,158.196,120.993,29.2,43.38,160.642,-89.63,112.92,123.258,115.375,123.132,35.914,-103.62,-177.168,160.326,-90.77,-71.93,129.5,114.042,-155.287,-89.633,109.992,-78.436,-155.608,130.862,-71.729,128.08,120.993,112.92,128.223,-103.62,167.17,-91.552,8.75,55.708,175.57,172.05,110.442,-17.33,-17.53,-172.525,-91.552,55.708,140.303,138.523,138.528,-144.017,-86.161,-155.287,-89.633,-28.08,-61.18,109.992,-61.165,29.2,-86.54,114.042,-155.287,138.523,110.442,123.132,-152.742,29.25,123.685,106.73,-172.51,140.799,-85.622,-76.4,-67.73,-71.93,158.836,55.708,116.47,-68.4,112.308,129.881,-69.797,55.708,124.737,112.92,127.894,29.25,29.2,157.203,-161.894,-163.97,116.47,103.13,138.528,140.281,103.13,-144.017,55.708,112.92,123.685,138.523,176.5,148.42,29.25,39.13,125.4,122.202,144.896,153.48,-26.46,-72.578,-89.633,112.92,-86.702,15.004,-144.017,140.281,112.92,130.862,15.004,138.523,-155.608,123.505,106.965,138.523,55.708,29.2,112.92,163.25,-76.4,125.4,29.25,155.196,145.037,-168.13,-84.233,130.862,143.036,55.708,131.104,168.346,127.33,121.601,-77.656,158.196,168.12,112.92,160.642,130.862,113.342,55.708,175.632,151.33,29.25,8.75,128.08,-163.97,-67.73,-71.377,-71.93,-76.936,121.057,127.33,138.528,-155.287,168.536,123.685,155.196,130.862,36.57,114.042,165.8,131.104,55.708,112.92,-69.797,-90.77,-17.33,115.375,110.442,175.632,-169.944,161.36,130.862,160.642,175.632,113.342,-20.28,123.685,114.042,-155.287,107.6,112.92,-155.608,140.44,-90.88,-155.287,-165.986,139.918,112.95,176.5,29.2,-72.578,127.33,172.05,140.44,-165.986,123.685,130.862,103.13,125.491,145.964,112.92,175.57,140.244,140.44,150.094,36.57,-69.895,-71.729,-78.436,-77.626,-84.233,-121.76,-72.614,108.058,168.12,110.442,158.836,141.38,55.708,150.05,140.44,29.2,123.132,138.523,140.244,131.104,130.862,141.38,110.442,124.05,29.25,155.196,155.565,-161.894,-77.656,112.92,-103.62,-71.93,-71.729,113.342,140.244,123.685,110.442,123.132,140.244,15.004,124.792,-71.377,112.95,-72.614,99.539,112.92,125.5,-169.944,-72.578,-72.117,175.632,-155.608,175.632,168.346,-165.986,-159.38,15.004,15.004,125.4,125.5,128.675,99.539,-172.51,112.92,175.632,124.05,-161.894,-71.729,164.7,-172.51,130.862,-17.33,12.02,123.685,138.523,113.342,110.442,-103.62,130.862,-85.622,15.004,-71.377,-68.4,-72.97,-77.37,29.25,29.485,106.965,-89.633,140.799,129.881,-103.62,140.757,123.685,113.342,139.376,109.208,114.042,127.4,145.161,112.95,15.004,160.509,160.642,-89.633,113.342,55.708,15.213,149.07,148.42,124.737,-113.35,158.712,-88.269,-72.578,-71.93,141.289,138.523,130.862,139.376,129.714,113.342,125.491,-70.568,145.161,-103.62,-77.37,110.442,125.37,55.708,175.57,-71.729,100.473,100.331,112.92,122.775,124.05,142.686,-69.895,-69.797,123.685,27.16,113.342,110.442,14.962,140.072,115.375,140.677,15.004,148.115,168.12,130.862,100.473,112.92,-84.233,-91.55,36.57,36.6,121.18,123.258,106.965,109.992,113.342,106.965,141.38,-17.33,112.92,113.342,-71.58,145.037,142.686,15.004,125.4,130.862,101.264,148.115,112.92,-155.608,-71.729,-103.62,-89.633,-165.986,140.757,-175.63,125.068,112.95,177.18,-175.63,123.685,168.12,176.5,106.965,175.632,-86.54,15.004,125.4,112.95,141.38,100.473,-177.92,112.92,-78.442,14.962,-78.436,-83.852,36.75,-174.87,165.8,151.23,124.05,-161.894,-103.62,-90.601,111.192,123.685,100.473,112.95,-175.42,-175.07,177.18,123.258,125.5,-78.436,114.042,112.95,-76.4,145.037,109.208,113.342,110.442,141.38,129.714,-78.442,-83.852,-68.83,127.53,175.632,145.964,-89.633,112.92,116.47,152.8,103.13,127.33,131.104,-89.633,-89.63,55.708,-88.269,-155.287,113.342,129.714,29.25,15.004,148.42,168.12,153.48,-85.622,155.196,109.92,100.473,-78.436,141.38,-153.43,-168.03,-89.633,125.5,125.4,109.992,-78.436,160.642,100.473,105.423,148.838,175.632,151.786,113.342,-85.622,147.35,15.004,43.38,-17.33,110.442,110.1,168.12,168.346,41.83,154.508,145.845,-166.923,-165.986,-163.97,-71.729,-67.73,-71.93,-88.269,-86.54,160.642,138.528,-89.633,109.992,-78.436,121.645,124.32,29.2,35.914,-103.62,159.15,103.13,151.786,123.685,175.632,139.963,122.833,-78.598,103.13,-89.633,158.836,114.042,98.501,169.23,-76.4,-69.895,-103.62,35.914,-155.608,-121.813,130.862,-90.88,-155.608,103.13,-89.63,-78.436,-61.305,-71.93,-84.233,-25.78,-161.894,145.733,141.284,118,125.185,43.38,-89.053,-89.633,-103.62,138.523,-22.5,15.004,103.13,150.875,-155.608,-78.436,-71.93,-89.63,153.2,160.642,161.36,112.92,99.539,-73.55,-73.585,15.004,101.264,120.993,-86.54,175.632,160.642,-76.4,-78.436,-174.87,55.708,-19.7,-68.83,152.203,-70.568,148.42,151.33,36.75,110.442,112.92,-168.693,-168.13,-171.252,-89.633,-92.109,158.836,-77.87,144.818,145.037,112.92,-68.53,113.342,112.95,112.92,-71.93,-155.608,-71.377,-71.729,-78.436,-68.83,-68.4,160.642,129.714,-175.42,139.394,55.708,123.685,-73.55,145.161,100.473,100.473,123.685,-155.608,-153.09,122.833,100.679,43.38,14.426,55.708,-71.93,109.208,-155.608,125.5,138.523,109.208,-155.608,-16.75,-67.73,-71.729,-83.852,-103.62,-104.3,125.37,15.004,120.993,-159.38,139.526,55.708,-103.62,141.166,144.818,113.342,15.004,-71.93,141.38,131.104,55.708,168.346,101.264,144.896,-89.63,14.962,140.44,123.685,27.16,-155.608,139.376,124.5,-17.33,-155.608,-178.794,179.58,145.8,120.993,102.62,122.833,131.104,-89.633,110.442,112.92,123.685,113.342,-155.608,-71.377,-71.729,-71.7,139.376,110.442,-103.62,144.818,43.38,154.175,-17.53,123.685,124.5,100.473,121.645,-155.608,127.33,55.708,124.673,100.473,140.303,125.37,-77.656,-60.652,168.12,165.8,36.57,9.17,27.16,139.918,-71.93,14.426,-76.4,125.37,113.342,106.965,-177.92,140.051,175.632,113.342,-104.508,-103.62,-121.813,139.394,167.83,123.57,-78.436,-86.54,-76.4,-70.903,15.004,113.342,-68.83,175.632,-78.598,122.775,-78.436,-103.62,139.918,138.523,113.342,-71.729,-89.633,165.8,-78.598,-71.93,-72.493,-71.349,-73.585,175.632,55.708,158.03,123.685,122.775,15.004,127.33,102.62,-68.53,-78.436,-78.598,122.775,121.645,-155.287,-155.608,-78.598,127.33,55.708,-89.633,128.223,127.894,9.17,-68.83,-88.269,112.95,-17.1,-86.702,140.44,141.38,-17.33,-27.32,-70.903,112.92,-175.63,-89.633,121.645,12.7,-153.09,-165.986,140.757,-78.436,-71.183,-78.436,106.965,-169.618,112.95,-89.633,-161.894,25.396,9.17,-83.767,-71.729,123.132,-155.608,112.95,110.442,-77.37,-121.695,160.642,-38.08,122.775,112.92,112.95,55.708,15.004,43.38,9.17,155.196,121.82,124.32,-166.923,-165.986,-70.903,-68.413,29.2,127.33,175.632,-71.377,-72.027,-71.93,127.4,-83.852,-83.767,15.004,114.042,113.342,168.346,125.4,-89.633,14.426,127.33,144.896,112.308,145.8,123.505,-71.729,55.708,-71.349,127.4,12.7,-68.83,-121.813,100.473,15.004,140.303,-89.633,36.446,41.83,168.346,168.12,175.632,-78.436,127.33,-17.53,110.442,-88.269,175.632,124.673,123.685,-71.729,-70.903,127.4,-71.377,175.57,41.809,122.775,100.473,55.708,-71.349,-69.797,-25.78,167.47,113.342,110.442,123.685,43.38,122.123,119.07,114.042,-90.88,-71.377,155.565,112.95,-19.05,112.92,109.208,55.708,123.685,121.94,130.657,147.92,-113.42,-70.568,-84.233,-91.17,-78.436,-76.4,114.042,-89.633,-121.813,156.014,-91.35,-87.57,-121.695,-71.93,55.708,175.632,113.342,112.95,-155.608,123.685,130.017,43.38,-78.436,-86.161,55.708,-78.436,112.95,-67.73,112.95,124.5,-89.633,123.685,130.017,43.38,-174.87,-121.813,-86.54,-88.269,-90.88,-78.442,112.92,165.8,150.875,-24.35,-122.18,-89.633,175.632,-90.88,145.161,142.686,15.213,43.38,112.95,123.685,121.86,-78.436,-77.656,-86.161,124.5,-78.436,122.202,-90.88,140.677,112.95,112.92,125.37,-89.633,-78.436,96.821,131.104,125.5,113.342,-90.88,167.47,14.426,-88.269,-78.436,100.473,-90.88,-155.608,165.8,43.38,158.836,-83.767,123.685,128.223,154.175,37.88,43.874,175.632,-72.493,14.426,-78.436,159.443,100.473,158.836,155.246,155.565,150.875,-89.633,115.375,-78.436,131.104,161.36,-68.53,-86.54,-122.18,-67.73,121.75,174.07,-174.65,-175.07,-121.813,138.036,-85.324,-17.33,158.836,158.196,155.461,102.62,-71.93,121.83,160.642,-78.436,123.685,-175.63,-91.186,140.839,-86.161,-122.18,106.965,-71.58,103.13,158.196,-85.324,-83.767,-121.813,-87.57,138.036,-71.349,123.505,15.004,160.642,-86.161,106.965,159.674,158.196,-24.35,-155.608,160.642,-165.986,159.443,9.17,55.708,-174.775,-86.54,-78.436,-71.729,158.836,159.674,-155.608,-61.165,-78.436,123.685,112.308,112.92,-174.87,55.708,-72.493,-8.146,55.708,-86.702,-122.18,-89.633,-93.228,43.38,37.583,152.203,121.75,-78.436,-91.408,-72.264,-57.93,-71.93,114.042,109.208,127.33,123.505,-91.35,110.442,113.342,-155.608,110.442,115.375,55.708,151.786,-86.54,-85.324,112.92,112.308,106.965,-122.18,-165.986,112.92,55.708,43.38,145.504,154.508,158.196,160.642,-67.73,109.92,-76.4,106.965,107.84,113.342,116.47,127.33,-83.852,-24.35,113.342,-122.18,109.208,127.33,123.579,55.708,-70.761,141.166,-91.55,12.7,110.442,130.017,139.963,-161.894,-174.325,107.6,127.33,123.685,110.442,-90.601,-97.27,139.394,154.508,154.175,153.02,124.865,55.708,100.473,-19.7,-161.894,100.679,140.303,-78.436,-71.349,-75.324,124.737,106.965,123.685,112.92,124.42,55.708,150.05,55.708,112.95,175.632,112.92,130.017,-88.269,-89.633,121.645,-85.324,140.303,55.708,-78.436,-77.656,-91.17,-77.656,107.84,15.004,100.679,113.342,106.965,-91.186,152.475,127.33,-155.608,107.84,112.95,115.508,125.185,55.708,-121.813,147.92,-77.656,-122.18,15.004,127.33,151.786,55.708,155.196,-60.652,112.95,112.92,107.6,101.264,120.993,-89.633,-163.97,-83.852,107.84,14.426,113.342,130.217,172.05,167.17,175.632,-71.93,106.965,44.3,-155.287,107.84,127.33,124.5,110.442,125.37,130.217,165.8,-113.206,160.642,-76.4,137.59,163.25,175.632,127.33,96.821,95.658,123.685,103.13,9.17,113.342,-159.38,15.004,113.342,112.92,-17.33,131.104,127.33,114.042,101.264,-163.97,-161.894,-89.633,-69.895,-72.493,-71.93,131.104,96.821,110.442,-91.186,-70.568,-61.664,107.84,112.92,137.59,125.37,177.18,-89.633,-71.93,139.526,109.208,131.104,125.491,-122.18,-72.439,-76.4,-87.57,127.33,14.426,172.05,159.82,128.997,112.308,112.95,-70.568,107.84,-72.493,-72.439,102.62,140.049,124.5,123.685,-84.233,-77.37,41.83,156.014,102.62,100.679,107.84,127.33,140.44,-91.186,124.737,43.38,100.473,110.442,-71.93,15.004,106.965,107.84,-155.608,130.862,112.92,55.708,93.858,158.03,107.84,-155.287,140.44,-122.18,12.7,127.33,-78.598,-75.324,121.94,112.92,112.95,-163.97,55.708,131.104,-164.43,-22.5,112.95,131.104,113.342,121.18,43.38,145.037,-170.629,-168.693,140.44,159.443,-70.903,-78.598,128.223,112.95,-69.832,160.642,-75.324,131.104,107.6,124.792,112.92,113.342,107.84,99.539,-178.146,-90.88,-69.797,-71.349,110.442,-77.37,-75.324,131.104,158.03,107.84,43.38,158.836,178.543,-170.054,-84.233,-76.4,131.104,-91.186,158.836,123.685,107.84,131.104,-91.186,-164.65,-163.97,124.673,-60.652,177.18,-91.186,-164.43,109.92,107.6,112.308,131.104,-166.923,-75.33,-69.832,-163.97,-90.88,113.342,-71.93,112.95,109.208,107.84,-75.33,-91.55,-69.092,-161.894,-163.97,-89.633,152.12,145.8,109.92,112.308,120.993,129.881,125.4,9.17,55.708,-13.63,14.426,129.881,55.708,113.342,42.18,-163.97,-170.629,-168.13,-155.287,-19.05,-77.37,-17.33,-155.287,-26.67,-26.587,-83.852,112.95,110.442,-71.93,-69.895,-75.33,108.058,100.473,-83.852,140.44,140.839,130.862,139.394,-70.033,-71.729,43.38,-19.62,113.342,140.049,119.07,115.375,55.708,140.44,139.394,125.185,15.004,-70.25,129.881,55.708,39.93,39.692,168.12,125.218,112.95,-113.35,-155.287,-164.65,-121.813,141.16,-71.349,-26.46,-27.57,118,-88.269,15.004,-91.55,123.505,124.737,160.642,-103.62,112.92,107.84,113.342,-8.146,-103.62,-91.519,109.992,103.13,-168.13,114.042,114.242,55.708,113.342,-168.693,-161.894,-89.633,-91.55,-91.17,-24.35,55.708,129.881,107.84,131.104,-17.33,-76.4,114.042,107.84,55.708,112.95,138.523,131.104,55.708,-71.93,43.38,127.33,55.708,-91.55,-177.92,123.685,-61.18,131.104,-175.63,-156.368,55.708,-91.55,-91.17,-91.28,160.642,129.714,127.33,147.131,160.642,125.5,55.708,146.252,-61.18,-61.664,-174.139,-153.43,114.042,118,110.442,15.004,-25.78,150.875,112.308,127.33,-25.78,139.526,55.708,42.83,110.442,-67.85,55.708,140.44,107.84,15.004,113.342,0,-28.08,120.993,125.37,115.508,43.38,140.072,144.013,107.84,55.708,160.642,9.17,100.473,110.442,140.44,131.104,113.342,-71.349,-71.93,109.992,-168.03,-103.62,108.4,-75.324,-89.633,-90.601,-168.13,138.528,153.2,131.104,112.95,140.44,141.38,159.674,-103.62,114.042,115.375,138.523,93.858,139.394,138.523,107.84,-78.436,15.004,55.708,15.004,-70.372,-98.622,-89.633,-166.923,55.708,125.185,-78.141,140.049,55.708,123.685,-91.35,-28.08,-122.18,-155.87,-130.55,140.244,145.8,145.122,107.84,33.792,150.516,174.07,-60.652,-70.595,-24.35,130.657,113.342,-90.88,-16.641,-89.633,-71.93,-61.664,-91.35,-77.656,-17.53,-16.75,130.657,110.43,110.442,165.8,55.708,-77.37,128.223,-168.03,140.44,14.426,114.242,-163.149,-164.65,93.858,-103.62,-164.65,-164.43,55.708,140.44,-103.62,-95.2,55.708,130.657,-17.53,148.115,-89.633,-95.2,156.014,160.326,77.53,15.004,114.042,55.708,-176.13,15.004,15.004,130.299,-61.165,-72.614,-175.07,-178.794,139.394,130.657,160.642,55.708,152.203,160.642,15.004,-86.845,-174.325,110.442,-178.794,-155.287,140.303,130.657,-72.493,-71.93,139.367,155.565,150.875,160.326,-178.794,-161.894,-155.287,-119.03,120.993,-174.65,124.865,160.642,55.708,93.858,160.326,139.394,160.642,160.642,160.326,124.865,-88.269,160.642,-71.409,55.708,15.004,93.858,141.124,140.072,-71.93,-70.372,110.442,55.708,-171.252,-172.51,-122.193,109.92,124.737,130.657,160.642,-77.986,-24.35,121.953,112.308,-71.409,-71.85,-61.18,-155.87,55.708,-70.903,130.657,14.426,-89.633,138.523,-22.5,-17.33,139.394,-177.168,140.303,130.657,-121.695,15.004,-174.87,131.104,-103.62,139.759,15.004,14.962,107.84,106.73,141.284,150.05,144.013,-71.93,130.657,158.836,148.838,153.25,-153.09,129.881,139.394,138.523,107.84,-71.93,157.339,159.15,138.523,-78.442,178.543,126.12,112.308,15.004,55.708,127.33,-90.601,108.4,129.881,124.792,55.708,39.13,-83.852,-175.07,-17.33,169.442,168.12,55.708,-170.054,127.33,121.75,122.202,129.881,-78.442,127.33,138.036,-78.25,55.708,107.73,108.4,109.208,-86.161,55.708,131.104,158.836,-89.633,160.642,127.33,14.962,112.308,130.862,55.708,-103.62,159.443,-71.93,127.33,160.642,-103.62,-89.633,14.426,36.292,100.473,138.523,-24.35,160.326,140.839,152.8,-103.62,130.862,-17.53,-88.269,110.442,165.8,-78.436,-17.33,55.708,130.862,-166.923,152.203,15.004,160.642,153.93,-71.93,123.685,-17.53,15.004,-19.7,55.708,-78.436,-61.05,-91.519,129.881,131.104,124.5,153.25,153.2,152.12,-72.493,-86.845,-85.324,-86.54,15.004,14.426,139.526,15.004,15.004,127.33,-70.568,138.523,160.642,-161.894,129.881,-88.269,-27.32,106.965,-71.93,55.708,127.4,-172.525,-175.508,-78.25,-71.93,-71.729,-101.75,139.367,55.708,-72.117,-90.77,15.004,-28.08,130.657,-19.05,-18.5,138.523,15.004,174.07,110.442,138.523,120.993,-77.37,-17.33,55.708,138.523,112.308,-71.349,-71.377,110.442,-70.033,-71.45,-71.729,-71.93,-70.568,55.708,-78.436,-71.85,-84.703,-71.349,-71.183,-71.58,-17.53,-156.25,-155.608,-155.287,158.03,157.572,158.196,41.83,130.657,120.993,129.881,-71.377,-78.141,-78.436,-84.233,106.965,-16.78,137.587,-78.436,-71.93,110.442,14.426,-78.436,140.788,-103.62,-103.62,-78.436,-78.436,-78.436,-78.436,130.657,14.426,-71.93,-72.439,139.367,160.326,140.049,160.642,157.718,-78.436,-72.97,141.38,160.326,142.854,161.36,127.33,-17.53,-78.436,-71.93,160.642,-90.88,158.836,127.33,-86.54,55.708,-89.63,55.708,138.523,55.708,14.426,15.004,138.523,-8.146,-90.88,141.001,138.523,14.962,120.993,-13.63,-90.88,-71.93,-17.33,-155.608,159.443,110.07,114.042,150.516,138.523,-16.72,-16.78,-16.72,138.523,120.993,-17.53,-16.78,138.523,-78.341,-16.78,15.004,-16.78,-16.65,14.962,160.642,-83.852,-17.53,140.788,-19.7,-17.33,154.175,14.426,-16.78,138.523,-83.852,138.523,-89.63,129.881,138.523,55.708,-19.05,-71.93,-26.63,-28.4,138.523,126.12,-98.622,160.642,-177.92,-17.53,-75.293,138.523,127.894,130.862,-72.493,138.523,-61.18,-28.4,138.523,130.862,-91.186,-90.88,-17.53,130.862,-17.33,-17.53,120.993,112.308,130.862,-71.93,120.993,119.07,-71.93,138.523,154.508,-25.78,150.875,-17.83,129.881,139.526,125.4,-17.53,125.5,138.523,140.244,-103.62,-90.88,138.523,152.8,154.808,-154.682,-73.08,131.104,120.993,55.708,-87.57,-71.93,138.523,14.426,55.708,-71.93,138.728,25.396,120.993,141.38,-17.53,138.523,-17.33,-90.88,-16.641,130.862,130.657,-17.53,-90.88,-71.93,-16.641,138.523,138.523,55.708,-90.88,128.08,15.004,-17.53,14.426,145.037,148.115,151.33,174.07,36.33,161.36,-121.113,-163.149,-155.287,138.728,-12.28,-77.986,-90.601,126.65,-90.88,-88.269,108.4,-78.436,-98.622,14.426,160.642,-17.53,-17.33,14.426,-61.664,138.523,139.394,-72.578,140.677,140.44,130.017,125.185,15.004,130.017,-19.7,129.144,-90.601,131.104,-77.656,-61.664,130.862,129.881,107.84,-90.601,-103.62,-128.9,140.839,155.461,156.753,15.004,15.004,14.962,-71.93,130.017,127.33,-90.601,-97.27,127.33,141.001,-90.88,14.426,-90.88,-87.004,-86.845,-155.608,-17.33,-87.004,139.394,105.423,131.104,129.881,125.185,130.017,-57.93,-25.78,15.004,14.426,-71.93,-17.33,105.423,125.185,-155.608,-87.004,110.442,-90.601,130.657,130.862,140.757,-17.83,-71.409,-70.903,130.862,110.442,127.33,131.249,131.104,125.4,122.775,-71.93,-90.601,127.53,110.442,-28.73,55.708,-71.93,-90.601,55.708,121.645,140.44,139.759,156.014,167.83,-77.37,-86.161,138.523,15.004,55.708,140.44,145.8,-71.93,140.44,-90.601,131.104,128.08,131.104,141.38,-70.903,-98.622,-121.508,-17.33,-95.2,-90.601,128.223,110.442,130.299,-98.622,140.839,130.299,129.144,-91.186,130.862,131.249,-70.903,138.523,138.523,-19.05,-78.598,138.523,129.144,123.505,147.12,177.98,-70.568,129.144,-17.33,138.523,127.33,136.771,140.049,130.862,-89.294,136.771,138.523,110.442,138.523,-71.93,138.523,138.523,-90.601,-16.72,174.07,14.426,15.004,127.33,-25.67,138.523,139.759,161.36,121.94,138.523,-90.601,15.004,14.962,42.229,25.396,156.014,158.196,-104.3,-155.287,-155.87,-155.608,-152.742,-152.251,-153.43,-153.09,9.17,151.23,159.82,121.708,-71.377,-130,138.523,131.104,139.376,55.708,138.523,127.33,138.523,-71.93,138.523,15.004,-17.83,127.4,125.5,138.523,120.993,-71.93,138.523,-72.493,-78.442,145.037,145.964,139.526,15.004,130.657,-98.622,-71.93,120.993,112.308,140.44,-77.37,-60.652,124.892,140.677,-71.729,-72.493,-63.23,-61.18,-78.442,-155.608,55.708,-72.646,140.839,-25.78,-17.33,114.042,-71.93,-20.28,131.104,139.394,14.426,130.862,-19.7,129.881,127.33,120.993,-61.165,15.004,120.993,139.394,129.881,12.7,-17.33,-71.93,14.426,131.104,41.63,14.962,-25.32,-177.92,140.44,-90.88,-17.33,130.862,-78.341,140.839,14.962,-19.05,139.376,-113.206,-71.93,140.44,-90.88,-90.601,139.394,-75.324,-103.62,140.44,-17.33,131.104,130.862,-90.88,-113.42,140.44,-17.33,140.303,14.962,-90.88,-71.93,145.037,-77.37,123.685,129.881,130.862,15.004,-90.88,131.104,130.862,-97.27,-86.845,139.394,-19.05,131.104,-19.62,-71.93,-103.62,131.104,15.004,-172.525,-155.287,-122.18,-17.33,-71.93,138.523,129.881,127.33,120.993,15.004,-103.62,139.766,138.523,139.766,127.33,-86.54,140.303,-71.93,-17.33,15.004,139.394,140.303,140.303,-70.85,138.523,156.014,144.013,-104.3,159.65,55.708,129.714,-61.664,-72.614,-71.93,131.104,-17.33,138.523,130.862,129.881,138.523,114.042,-19.7,42.229,138.523,139.526,138.523,-75.324,130.862,165.8,-71.93,114.042,131.104,-98.622,138.523,138.523,120.993,138.523,-103.62,-98.622,-130.55,112.95,174.07,-77.656,-77.986,130.862,-90.88,130.862,131.104,110.442,-90.88,129.881,112.308,137.587,130.862,-17.83,-90.88,-103.62,131.104,110.442,-71.93,131.104,-22.5,138.523,-78.598,131.104,138.523,136.771,-71.93,-90.88,-77.37,-19.05,-28.08,-98.622,155.225,136.771,15.004,-91.186,-71.93,-86.54,131.104,130.862,-89.63,-103.62,-78.598,-72.493,-89.294,130.862,131.104,131.104,120.993,-98.622,-89.63,148.019,142.686,25.396,14.426,174.07,-77.986,-86.161,-75.324,-97.27,159.82,-104.508,15.004,130.862,-78.598,130.862,-97.27,-90.601,127.53,131.104,-25.47,-71.93,-25.47,-28.4,131.104,-71.93,127.33,-103.62,-158.17,130.217,110.43,110.442,174.07,-83.852,-73.17,131.104,15.213,-71.93,-78.442,-76.03,-19.7,136.771,130.862,110.442,-71.93,139.394,-90.88,-86.161,127.894,127.4,14.962,29.2,174.07,-179.97,150.516,-119.03,-158.17,-120.57,-178.146,-178.006,161.36,140.877,141.38,144.013,158.836,159.443,160.326,159.674,160.27,160.251,-82.543,-91.55,-70.903,-62.18,-61.18,-19.05,-72.439,136.771,-98.622,110.442,112.308,136.771,-97.27,139.285,140.933,-71.93,131.104,-90.88,-98.622,-104.508,15.004,-77.656,-90.88,15.004,-155.608,-153.43,-98.622,-71.93,14.139,127.33,-71.93,15.004,-71.93,15.004,139.526,-77.37,-78.436,-78.436,131.104,-78.436,-90.88,-98.622,-152.742,167.83,105.423,-17.33,-86.845,-87.004,-86.688,-98.622,138.523,138.523,-86.845,-71.93,-122.18,-90.88,-89.63,130.862,-86.161,-86.54,-71.93,131.104,-89.63,-17.33,-71.93,-98.622,-103.62,139.766,-98.622,-71.93,-71.93,-98.622,119.07,126.65,138.728,-19.7,-17.33,-88.269,-155.287,-155.608,-152.742,127.33,95.658,-17.33,-71.93,131.104,131.104,-91.186,-98.622,-71.93,-19.05,-87.57,-17.33,-60.652,-24.35,-155.608,-155.287,157.407,141.38,174.07,175.632,14.426,-71.93,-71.93,15.004,-16.641,-71.93,-72.33,-17.33,-155.287,-98.622,139.766,131.104,-71.93,-122.18,112.308,-122.18,110.442,174.07,-61.18,-17.83,-62.18,-71.93,130.657,-19.17,-17.53,-71.93,131.104,130.657,139.394,-17.33,-71.93,-17.33,138.528,-155.608,130.217,37.88,139.526,-91.186,-17.33,130.657,-71.93,-71.93,112.308,-156.25,-155.287,137.587,148.019,-61.165,-71.409,122.01,-71.93,0,112.308,112.308,120.35,124.737,33.554,-177.92,150.516,152.203,159.443,140.788,141.001,-90.876,-121.76,-17.33,-19.05,-91.35,-71.93,15.004,15.004,14.962,15.004,-25.78,139.394,42.229,-25.32,-19.7,-19.05,-61.664,-77.986,-84.703,55.708,130.217,110.442,137.587,-155.608,131.104,138.728,131.104,-71.93,-17.33,-25.32,130.308,168.536,161.36,27.16,-22.5,139.394,-165.986,-156.25,-179.97,-71.93,139.394,-19.05,139.394,-71.93,112.308,139.963,-155.287,-17.53,-71.93,15.004,139.963,139.963,-71.93,42.229,41.809,174.07,140.44,158.836,159.674,-177.168,-152.742,-84.703,-27.32,-130,139.963,-61.18,112.308,-71.93,-17.33,140.757,-155.608,-158.17,-19.7,-71.93,131.104,112.308,-71.93,15.004,124.892,110.442,-119.02,-72.614,131.104,131.104,112.308,131.104,124.792,109.92,-18.5,-17.33,-61.165,-61.664,-155.608,-17.33,-16.65,138.036,-93.228,-90.601,-155.608,-156.25,-152.742,178.973,-19.05,-17.33,-98.622,-156.25,-119,160.251,160.27,158.05,145.122,156.875,154.808,141.166,-179.97,-172.525,150.88,15.004,35.914,174.87,121.3,-17.33,-17.53,-8.146,-75.324,-83.767,-78.436,-91.17,-78.442,-71.409,-71.85,-98.622,131.104,-19.7,-17.33,-21.83,131.104,130.308,55.708,174.07,-155.287,145.8,140.877,-22.1,-22.5,-61.664,-61.165,-82.543,139.394,131.104,112.308,15.004,-17.33,131.104,131.104,140.244,158.03,-128.9,-75.293,15.004,-61.18,-22.1,131.104,105.423,144.443,-19.05,112.308,176.5,-172.525,-155.608,-72.493,-17.33,139.394,131.104,13.897,-19.7,-16.75,-16.78,36.33,174.07,110.442,141.001,158.196,157.718,-130,13.897,125.07,-112.5,145.504,-17.53,-17.33,-77.986,131.104,15.004,10.87,131.104,-78.9,-84.233,0,131.104,131.104,131.104,131.104,131.104,137.587,-99.758,-17.33,-17.53,-77.986,-61.341,131.104,0,131.104,-19.05,-61.165,-78.436,-97.27,-119.032,-130,0,116.47,39.78,46.12,144.013,142.686,-122.193,160.2,33.668,39.93,15.004,-17.53,-78.442,-91.408,155.246,139.394,-19.05,-22.5,-71.52,-155.87,-172.525,131.104,131.104,136.771,-22.5,130.862,-22.5,140.44,-153.43,110.442,14.95,14.962,36.33,-17.33,-130,140.44,-22.5,15.004,-22.5,-19.7,37,-158.17,-72.493,-72.117,-22.5,-22.5,-22.5,-19.05,-17.53,175.57,-19.7,-60.652,-27.32,-21.83,14.962,-152.742,-152.411,-122.193,-156.25,-104.3,-89.294,138.32,158.05,158.836,14.139,15.004,129.926,110.442,-93.228,-155.608,-61.165,-17.33,-22.1,130.862,140.44,139.394,109.92,176.33,-75.389,-62.18,-22.5,-19.05,0,-97.27,-155.608,139.021,-25.32,-19.17,0,130.862,15.004,15.004,36.33,-179.97,-90.601,-152.742,-17.53,-19.7,15.004,139.526,-22.1,-19.05,-91.28,-91.55,-91.546,-17.33,159.443,-97.15,-155.87,-119.03,161.36,-177.168,-166.923,14.426,169.442,105.423,110.442,-155.287,-72.117,14.426,-155.608,-78.436,-82.543,-152.742,36.33,130.862,130.862,42.229,130.217,-103.62,-83.852,-25.78,138.523,-19.7,-86.54,140.799,158.836,-113.13,130.217,151.158,36.57,110.442,-17.33,-72.396,139.526,138.728,-70.903,-17.53,144.561,-121.554,-156.25,-111.678,-22.1,145.964,174.07,-155.608,15.004,-91.17,-86.32,-17.33,-16.641,-19.7,-75.293,36.57,43.38,150.516,105.423,-155.87,-112.67,-155.287,-158.17,-156.368,-178.146,142.686,159.443,160.326,136.771,-155.608,14.962,-172.525,-77.986,14.426,161.36,138.728,158.03,-152.742,-92.109,36.57,155.225,130.308,-78.442,-84.703,-84.703,-179.97,-156.25,161.36,-156.25,130.308,110.442,-17.33,126.53,14.426,126.53,-21.83,-61.64,160.2,157.407,-119,157.572,159.15,158.05,160.326,37.75,112.308,130.862,-130,138.728,14.426,14.426,-156.25,138.036,-156.25,-121.508,-90.88,161.36,130.217,174.07,14.426,55.708,-19.05,-22.23,-17.33,140.281,160.326,160.595,160.725,159.443,158.196,142.686,144.013,-130.63,-163.97,-104.3,-121.49,-121.8,15.213,150.516,151.1,124.05,105.423,167.17,-25.78,-21.83,-19.98,-19.05,-78.436,-91.35,-91.55,130.862,128.08,-155.608,110.442,-25.67,-17.53,140.049,138.728,-19.05,138.728,-104.508,-153.43,-78.598,14.962,-155.87,-19.05,-19.62,-22.5,-61.33,-27.32,140.88,-156.25,-121.76,-17.33,-61.165,-21.83,-72.493,-61.18,-22.1,-70.568,-17.83,-60.652,-121.113,-155.287,-90.88,158.836,160.251,160.326,14.426,-95.2,-121.554,-61.165,-77.37,138.036,139.394,139.27,130.57,140.44,-179.97,-121.508,-90.601,-77.986,-17.53,-21.83,130.57,140.049,138.728,145.83,110.442,-19.17,-17.53,131.104,131.39,131.104,138.728,14.426,-72.97,-72.117,130.862,130.862,139.27,139.394,139.526,139.766,145.161,160.595,160.27,160.32,-104.3,-155.287,-122.193,-177.168,160.97,105.423,32.75,-177.92,169.442,-16.78,-25.67,-141.75,130.862,-25.32,139.153,139.394,140.734,130.862,139.526,140.049,138.728,160.251,-121.554,-155.608,130.308,138.728,-98.622,139.394,174.07,13.897,-27.32,-19.05,140.049,138.036,-155.608,140.799,140.072,138.728,139.376,158.05,-121.554,-121.508,-91.519,157.718,-78.442,-16.641,-19.7,-130,150.094,-156.25,-61.33,130.862,14.426,138.728,-122.18,-93.228,14.95,-19.05,130.657,131.39,-155.87,130.57,-179.97,-78.436,130.657,130.657,-71.409,130.308,129.926,161.36,139.526,158.196,160.27,154.808,-84.703,-75.293,-75.389,-68.541,-19.7,130.862,118,-78.436,-78.442,145.964,-103.62,14.962,25.396,130.57,-121.554,-152.742,138.728,-61.165,130.657,139.394,140.049,150.516,-82.543,-72.614,130.657,136.771,139.394,144.443,160.32,160.595,157.572,158.836,-158.17,161.36,130.862,-177.92,35.914,-84.703,-16.641,-13.63,-25.47,-72.439,-83.852,-121.229,150.516,137.587,138.523,14.426,139.394,152.203,110.442,139.394,-121.774,-155.287,-155.608,-19.05,-75.324,-25.78,130.57,139.394,150.094,39.92,132.621,160.27,160.251,161.36,82.5,-19.7,-84.703,-78.364,-61.165,121.52,39.78,-89.294,-152.742,37.25,-179.97,-61.305,-83.767,0,110.442,161.36,-155.608,137.587,139.394,-119,-130.63,157.339,-19.05,55.708,130.217,130.57,160.595,144.013,142.686,139.394,140.244,161.36,-155.608,-78.442,-25.67,-60.652,-19.05,-93.228,-90.88,161.36,-152.742,139.394,140.757,-153.43,-71.502,138.851,145.122,160.326,160.642,160.251,158.03,-165.986,157.718,-155.608,130.57,15.213,-177.92,174.07,169.442,-19.62,-78.815,-78.436,-78.598,-84.703,-19.7,-19.05,13.897,110.442,-155.287,-103.62,145.83,14.426,138.728,161.36,14.962,138.851,138.728,-152.742,145.964,174.07,-179.97,-72.614,14.426,0,-13.63,-19.05,-72.117,44.08,161.36,136.771,139.526,-119,-121.229,-121.841,-121.695,-155.608,-95.2,-93.228,-179.97,110.442,-78.442,14.426,109.992,122.01,123.685,138.728,-158.17,55.708,-155.608,-155.287,138.851,140.877,144.443,160.725,160.326,-89.053,-61.165,-119,-121.767,-152.742,-121.76,131.104,-85.324,-83.852,-72.493,-122.18,-155.287,15.004,105.423,110.442,-73.17,-130,-90.601,-99.13,-164.43,160.326,158.836,140.799,138.728,173.9,-179.97,-177.92,-19.05,-71.502,-84.703,-72.97,-61.341,174.07,130.308,158.45,161.36,-95.2,-25.78,14.426,138.728,131.249,-61.664,-78.436,-91.17,138.523,138.728,157.572,160.326,160.32,144.561,156.978,142.686,-119.03,-155.608,126.5,-179.97,147.35,-78.442,-75.324,-61.165,-19.7,177.98,-165.986,-153.43,139.394,-72.431,-71.93,139.963,112.95,-179.97,139.526,-119,150.516,-155.608,-163.45,140.44,138.728,157.58,-61.165,13.897,-152.742,-119.02,-19.05,-69.142,-78.463,110.442,130.57,-179.97,-122.18,-78.815,-19.05,-19.05,-77.986,-75.33,-82.543,139.526,176,0,15.004,15.213,122.01,105.423,139.394,138.728,139.963,158.03,158.196,160.326,160.595,144.013,139.367,-98.622,-172.51,161.36,-19.7,-16.78,-62.96,-16.641,157.572,138.728,176,109.992,161.36,-122.18,14.426,-179.97,-97.27,138.728,-72.614,-61.165,-84.233,-91.28,14.426,44.08,138.728,136.771,158.03,159.97,141.16,-99.13,-121.49,-155.608,-177.168,-121.113,-158.17,-78.442,-77.986,-72.88,-19.05,-23.78,-16.641,-27.32,-144.017,-152.742,-122.18,-93.228,112.95,110.442,176.08,176.5,-78.436,14.426,-172.525,161.36,-77.986,-62.8,-25.47,-72.614,-21.32,-19.17,-78.436,-91.35,-86.161,-17.53,15.213,174.07,150.027,130.57,-122.193,-155.287,-155.608,144.561,160.595,160.326,139.394,141.001,13.897,14.962,24.439,-97.27,-72.117,-19.05,-61.165,130.57,126.047,110.442,55.708,-95.2,161.36,-152.742,-72.117,-71.93,-78.442,-60.652,161.36,-155.608,-122.18,138.728,158.836,144.013,15.004,174.07,-177.92,-97.27,-90.876,-16.641,-25.78,-69.142,-71.409,-71.502,-25.32,-156.25,145.122,13.897,14.426,-121.93,-92.109,-152.742,-27.32,-78.436,-78.598,-141.75,-62.8,-61.165,157.718,82.5,-122.193,-155.608,158.03,158.196,157.203,160.326,160.595,138.728,138.528,14.962,15.213,42.442,168.12,25.396,13.897,-121.767,-97.27,-72.614,-83.767,-16.641,-15.58,15.004,130.57,-16.641,-19.05,110.442,15.004,-119,-61.165,-77.986,-15.58,142.686,120.7,13.897,161.36,-93.228,14.962,-155.608,15.004,15.004,174.07,15.004,15.004,15.213,33.668,35.914,38.78,-177.92,109.92,-129.27,-121.554,-155.287,-155.27,-121.767,-104.3,-105.32,-105.43,144.013,141.38,148.838,160.533,159.15,140.281,139.021,137.554,140.799,140.877,139.526,3.351,-16.78,-17.33,-78.25,-78.436,-78.442,-86.342,0,-155.608,-27.32,130.57,126.047,-155.608,-155.87,-16.641,-71.409,-19.05,-21.32,-71.502,-73.4,-27.32,-152.742,-179.97,14.962,13.897,-152.742,-168.13,-122.18,139.153,131.249,138.728,158.196,160.326,141.38,-60.652,-72.614,-78.442,11.93,-153.43,-72.97,15.004,15.004,14.962,-113.5,15.004,15.004,14.962,174.07,-122.193,-95.2,-121.76,161.36,160.27,140.244,139.766,139.394,-19.7,-76.4,-152.742,110.88,125.07,-84.703,-86.161,0,0,-77.986,128.08,14.962,138.728,-22.1,-72.27,25.396,13.897,-179.97,176,136.771,131.39,140.799,160.326,158.196,157.572,-98.622,-155.287,-155.608,-22.5,-61.165,-75.33,-75.324,0,-99.42,-72.493,-152.742,15.213,14.962,14.426,-152.742,117.77,-122.18,159.15,-71.502,-72.153,-77.986,-78.436,112.308,147.35,-177.92,160.27,139.963,-122.18,-121.76,-71.183,-19.05,-60.652,-19.7,12.7,23.336,-113.5,-90.876,-77.986,-78.442,-84.703,-155.287,-130.3,-152.742,145.122,151.23,130.57,130.308,-122.18,-156.25,-155.608,-121.49,-113.22,161.36,144.013,157.711,176.5,14.962,-61.165,-16.78,-71.409,-153.43,-69.5,-78.617,-71.377,0,-72.614,-179.97,110.442,0,151.23,153.65,15.213,-153.43,-152.742,-158.17,-156.51,157.407,-113.5,-121.767,-155.87,158.03,160.27,137.587,140.799,141.001,139.766,14.962,-25.32,-17.83,-19.05,13.897,-90.876,-152.742,-84.703,-152.742,-156.25,156.014,15.004,-179.97,128.849,125.07,137.587,138.32,139.376,-155.87,-155.608,-121.49,-152.742,-121.76,161.36,-78.436,-22.5,-123.5,-155.287,-152.742,174.07,15.004,-19.05,-61.341,0,-61.165,-155.87,141.166,95.25,9.17,160.595,158.196,141.001,140.049,-152.742,-153.09,-78.463,-77.986,-152.742,13.897,14.962,15.004,-172.525,13.897,-77.37,-72.117,-78.442,-16.78,109.92,-121.76,-155.253,161.36,-155.608,-25.67,-77.986,-16.641,128.83,138.728,-122.18,-61.18,-19.05,42.229,43.874,44.3,175.632,-121.49,-122.193,-178.146,-166.923,160.1,-155.253,140.072,138.528,140.303,158.07,160.703,160.765,159.674,159.804,144.013,142.854,141.38,154.808,-19.05,-62.96,-91.408,-86.32,-60.652,-18.03,-77.986,-19.05,177.98,-156.25,-61.664,-16.641,-15.58,0,-15.58,-61.165,-71.502,140.281,174.07,-72.58,-61.165,-19.05,14.426,-179.97,139.394,139.759,139.526,-155.608,-152.742,157.718,116.47,-152.742,-121.76,-75.33,-61.165,-15.58,-130.55,-152.742,131.104,114.242,-83.852,150.516,130.657,130.57,-121.76,-155.253,159.65,161.36,-122.193,-103.62,140.049,159.674,160.27,-75.389,-19.05,-16.78,-19.7,42.229,159.65,-22.23,-71.93,-16.641,-27.32,-152.742,-179.97,-78.463,15.004,13.897,130.57,110.442,-121.76,-93.228,-119,160.326,158.03,139.963,138.036,-72.13,-19.05,-60.652,-155.87,-61.165,-75.293,-19.05,-61.18,-60.652,-25.78,-19.7,44.5,-95.2,-130.63,138.114,139.098,140.88,139.153,160.326,-84.233,-85.622,-152.742,45.74,161.36,-97.27,-121.554,138.728,-19.05,42.229,-152.742,-72.97,-73.4,-86.54,-60.652,-155.361,-157.185,159.83,-155.287,-121.767,-121.93,-121.841,-122.18,140.734,160.326,158.385,144.013,139.367,176,-72.88,-61.664,-84.703,-83.767,112.95,-122.18,-152.742,-121.113,-122.193,158.385,159.443,160.27,159.674,141.289,137.587,-75.365,-75.324,-19.05,-25.67,-19.7,-19.05,-152.742,145.964,14.426,-61.165,-16.83,129.926,161.36,-121.93,137.59,139.394,-15.58,-19.05,-71.52,-77.68,138.728,157.711,13.897,-72.33,-27.32,-31.216,-18.03,-91.408,-78.364,-61.305,14.962,159.45,140.244,139.526,-155.608,161.36,-90.407,-72.153,-61.664,-19.05,-72.117,131.249,160.27,-23.78,-78.442,-15.58,161.36,-122.18,160.32,138.728,176,110.442,-179.97,-91.186,-121.841,138.728,-152.742,-21.83,-78.436,-75.293,-86.342,-16.641,165.5,-152.742,-148.433,-178.146,-104.3,-129.27,139.021,139.394,140.303,140.049,160.27,160.642,157.711,141.166,140.811,176,165.8,155.62,15.004,120.35,130.657,14.399,-22.1,161.37,-152.742,-155.87,-121.554,-92.109,12.02,-71.93,0,130.308,-179.97,-122.18,-152.742,159.443,139.759,-19.7,-69.142,-83.767,138.528,138.523,174.07,130.217,-156.25,-103.62,-101.75,-155.87,-122.193,-152.742,-175.13,139.098,139.766,141.001,140.877,160.27,130.299,-172.525,-78.364,-19.17,-19.7,-16.641,0,-19.05,-77.37,-108,-98.032,-103.62,-129.33,-122.18,110.442,-15.58,-19.05,174.07,0,-31.216,-16.65,-17.53,45.1,-179.97,-177.92,-96.75,157.718,139.394,139.759,139.021,138.114,-152.742,-19.05,-78.598,-71.93,-156.25,-75.324,-84.703,-91.17,-73.75,-16.75,-19.7,-15.58,-26.67,-117.46,139.766,139.526,139.27,141.001,140.757,176,174.07,155.62,131.104,-82.543,-19.05,-170.3,-19.05,-25.47,-77.986,-155.608,138.728,-179.97,14.962,-156.25,-152.742,-75.293,-61.664,-70.196,-17.83,-95.2,-103.62,161.36,36.446,176.5,-93.228,-99.758,-110.67,-152.742,138.728,140.734,160.27,160.595,158.836,142.686,156.753,131.104,-19.7,150.516,-61.165,42.229,159.443,140.734,139.021,-16.641,110.442,15.004,-83.767,14.426,139.963,-19.05,-84.703,138.728,140.799,139.394,139.526,142.854,-121.229,-103.62,-179.97,130.299,130.217,130.57,0,0,176,13.897,-72.117,15.004,130.57,-97.27,161.36,158.836,141.001,155.461,138.728,-152.742,-71.377,-78.436,-19.05,-152.742,128.83,-177.168,160.87,-152.742,-152.411,-155.287,140.281,144.443,157.339,158.712,158.07,160.595,159.97,130.57,14.426,35.914,-19.17,-60.652,-19.7,174.07,-152.742,-90.88,-69.5,-78.25,155.246,140.44,-176.747,-61.18,-122.18,25.396,130.57,0,0,-19.05,-158.17,-155.253,161.36,-155.287,-155.87,-155.608,141.001,160.27,160.703,160.326,131.104,14.139,-77.986,-77.68,-84.703,-19.7,-16.641,42.229,-25.32,-19.05,-113.5,-122.18,-152.742,0,-16.641,-19.05,-152.742,161.36,-155.608,158.836,143.036,174.07,-179.97,-72.493,131.249,-21.32,-121.93,-155.608,-166.923,-155.361,-159.38,138.036,142.686,160.326,176.5,-22.23,-19.7,155.461,-122.18,110.442,-84.703,130.57,55.708,-155.092,-155.608,-156.25,159.674,140.244,140.072,139.526,139.759,-77.986,-22.5,-61.305,-61.664,-71.93,-152.742,-153.43,-85.324,-73.585,-130.55,130.308,131.104,-152.411,-156.25,-121.49,138.728,154.808,-19.05,-77.68,-19.7,-25.47,155.246,-122.18,-78.598,-69.5,-152.742,14.139,-101.75,-98.622,-103.62,-161.214,110.442,-72.97,44.75,-158.785,-177.168,-156.25,-155.608,138.036,-19.05,-19.05,-72.614,132.621,124.892,-156.25,-103.62,157.718,-155.253,158.712,-19.05,-17.33,-27.97,155.461,15.004,-16.641,-71.93,-75.33,-172.525,-177.92,14.139,45.551,24.27,158.03,139.963,139.376,140.44,139.526,141.001,161.36,-155.608,-19.05,-23.78,-62.8,130.57,-61.18,-19.05,-93.228,-155.87,-152.742,-153.43,14.139,147.12,45.17,33.668,130.657,130.862,120.47,131.104,-153.09,160.82,126.53,-155.608,-122.193,-104.3,-101.75,139.73,141.001,139.766,139.098,138.728,158.03,158.196,157.203,159.443,160.326,144.561,144.013,-19.05,-22.23,-19.98,-78.436,167.17,-25.78,-16.75,-155.287,14.139,34.52,-78.598,-77.68,-75.389,-61.165,-122.18,161.36,158.836,139.098,138.114,-97.27,-19.05,-72.33,-156.25,30.25,-95.2,-61.18,-71.93,-155.608,161.36,-177.168,158.196,174.07,14.139,155.62,131.104,130.299,128.08,-19.05,-19.05,-61.18,161.36,-155.287,-107.035,158.03,-156.25,-25.47,-19.05,-78.436,-135.75,14.139,-152.742,-71.409,-99.13,161.08,-75.389,-71.93,-19.05,-72.97,-84.703,-78.436,-16.641,-155.608,158.03,159.443,159.674,160.27,156.978,140.877,108.058,-156.25,-127.5,145.733,-23.78,-61.165,-121.93,-97.27,-177.168,158.836,140.44,-16.641,-16.65,-67.765,-61.18,-19.7,-73.4,14.139,15.004,-122.18,-155.608,-152.742,159.443,13.897,131.104,-61.165,34.52,-98.622,-103.62,-61.18,-23.78,-69.5,174.07,-121.554,14.426,-19.05,-61.165,14.139,-155.87,131.249,138.728,139.766,158.03,159.674,44.3,174.07,130.308,-78,-19.7,-61.165,-62.18,-155.47,-156.25,-19.05,-78.617,161.36,-97.27,158.836,14.139,176,-78.815,-27.32,158.836,161.36,-155.47,-19.05,-19.98,-78.364,-76.936,-86.342,-86.54,-122.193,-121.76,-158.17,-163.149,139.766,139.394,138.728,136.771,138.523,137.587,131.104,-113.5,-156.25,14.139,-77.37,176,140.44,140.281,-73.75,161.36,130.299,-78.436,-75.389,-16.641,130.862,14.962,-175.13,-121.49,158.836,157.58,142.686,-61.165,-21.83,117.77,37.583,-19.05,130.57,174.07,55.708,13.897,157.407,141.001,139.766,-90.876,130.299,30.25,-101.75,-155.47,-155.608,161.36,-121.76,140.244,138.114,158.03,160.595,-60.652,-19.7,-155.87,-97.27,160.251,-121.82,-103.62,142.854,144.561,138.728,55.708,176,-84.703,-152.742,126.53,157.718,-122.12,-155.287,140.877,160.251,157.203,176,174.07,131.104,-19.05,-16.641,-152.742,14.139,176,142.5,130.657,161.36,158.196,158.836,139.526,138.114,110.442,-152.742,-19.05,-69.5,167.17,-19.7,-121.49,141.001,158.836,160.27,26.47,0,-23.78,99.7,130.87,-71.93,-25.47,157.572,140.244,26.47,46.02,142.5,-126.78,-61.165,-103.62,-152.742,161.36,-104.3,-100.25,-110.67,-122.193,139.507,138.728,141.001,140.757,157.328,159.15,156.978,154.808,144.013,26.47,13.897,15.004,118,130.657,130.862,124.05,-86.32,-25.78,-16.641,-16.78,14.399,176,-156.25,-110.95,123.685,-72.646,131.249,176,-61.165,-77.37,155.62,-152.742,-121.113,155.246,-164.43,176,-152.742,-103.62,-19.05,-84.703,0,161.36,142.854,159.443,158.836,137.59,-179.97,0,-60.652,-21.32,-61.165,-72.117,174.07,130.308,141.001,160.27,-152.251,-155.608,-121.49,-112.45,-105.93,-103.62,-19.05,-78.436,-61.165,-155.287,-61.664,-20.58,-84.703,-19.7,-155.608,-103.62,139.766,140.44,-155.47,-19.05,-19.05,15.004,139.566,158.836,176,-61.165,-95.2,-130.55,160.82,159.443,158.03,138.114,138.523,-19.7,-16.641,40.48,130.217,-19.05,-78.617,-71.85,-129.1,161.36,158.836,157.339,159.674,34.52,-78.598,-75.33,-20.87,-61.165,123.38,15.004,-103.62,-19.05,-71.409,0,-16.641,140.788,0,-17.33,-75.365,-19.98,132.621,136.771,160.27,158.27,158.03,144.013,140.811,144.561,144.443,-121.49,160.65,128.83,-121.113,14.962,45.17,120.35,130.862,120.993,13.897,176.5,-179.97,158.03,-152.742,-103.62,-4.02,131.104,-19.05,-20.87,-152.742,-121.76,-166.923,161.36,158.196,139.394,-71.377,-19.05,-155.47,-152.742,138.728,139.021,138.114,158.836,-98.622,-19.05,-72.431,-71.93,-152.742,-73.4,-78.287,-20.87,-21.32,-19.7,-16.641,-176.747,-155.608,138.528,139.394,141.001,131.249,158.836,-19.05,-22.5,-75.389,-121.49,-135.75,-19.05,-61.165,-121.76,-154.028,-175.13,-119,159.45,140.072,140.44,155.246,13.897,-78.436,-72.97,-152.742,141.166,158.03,136.771,-20.87,-84.703,0,118,-97.27,-19.05,-61.165,-20.28,-84.233,-19.7,158.03,160.642,-16.641,0,-16.65,-20.87,-22.5,138.114,139.394,44.5,176,150.516,-152.742,0,-71.409,0,-25.67,2.97,15.213,45.17,36.292,130.299,-152.251,-172.51,-104.3,-119.02,-117.45,-121.49,-122.193,-129.27,140.303,160.32,158.196,158.836,156.753,156.6,-17.83,167.17,-16.78,-16.65,-19.7,-86.161,-20.87,-23.78,-62.18,42.229,-154.028,-19.05,-113.5,126.047,121.52,176,157.572,139.602,138.523,-103.62,-19.7,138.728,-78.815,-101.75,-153.43,-165.986,140.44,140.244,139.376,140.88,158.03,159.443,155.62,15.004,26.47,-19.7,-86.342,-17.53,-16.641,158.836,-19.05,-72.117,-19.05,-19.7,158.836,139.394,161.36,160.2,-99.13,-113.5,-155.608,15.213,-20.87,-20.28,-19.05,-75.293,-72.614,140.281,138.114,158.03,-69.142,42.229,158.836,158.03,140.677,139.963,141.001,139.27,161.36,130.308,130.862,-78.436,-19.7,-178.475,-152.742,-19.05,0,-86.32,-17.53,-155.253,161.36,140.734,158.836,-155.87,0,-19.05,-103.62,12.02,0,-20.87,-72.117,-84.703,-71.33,-121.229,158.03,160.32,160.27,160.02,141.001,139.394,40.48,158.836,-72.117,-97.45,131.249,158.03,159.674,140.677,-103.62,-121.8,-20.87,-16.97,-61.165,-152.742,45.74,161.36,157.47,-121.813,-121.49,144.013,156.753,145.504,160.326,158.196,157.572,157.203,158.836,140.244,139.279,12.02,15.213,-23.78,-20.28,-19.7,-19.17,-25.47,167.17,-17.53,-17.33,0,-25.32,139.777,0,-17.53,158.03,140.677,-113.5,140.839,-19.05,42.229,-69.5,-15.58,-16.641,-19.7,158.03,158.196,159.674,140.072,139.766,-155.287,-19.05,-15.58,0,-72.117,-121.229,-97.27,110.442,176,-130.55,-177.168,138.523,158.196,158.03,-19.7,138.728,-92.109,-61.341,-72.97,-19.7,-19.05,138.114,158.03,157.572,-156.25,-121.229,-18.03,-17.53,-78.463,-75.365,-179.97,15.213,130.657,0,-19.05,-152.742,-126.78,42.229,148.15,-121.76,160.27,141.001,-19.17,-78.598,155.246,-121.229,-19.05,-71.161,-17.83,-152.742,161.36,140.63,157.572,141.001,139.394,-72.794,42.229,-121.695,152.2,158.03,-19.7,-72.97,-121.229,-103.62,-152.742,0,-17.53,-16.72,-21.32,158.196,136.771,-73.08,-19.05,139.766,-72.614,-19.05,-22.5,-19.7,-19.17,-71.7,-85.153,139.602,140.072,158.196,158.712,159.15,160.27,159.674,160.595,-153.09,-121.76,167.33,-104.3,-155.27,-129.27,151.1,15.213,36.23,130.57,-69.241,-84.703,176.25,-121.229,138.728,-19.05,-70.568,-72.117,42.229,176,-172.51,-152.251,174.07,15.004,-121.49,-155.47,-98.622,158.03,-67.73,-19.7,42.229,-75.33,-19.05,98.98,157.572,-123.732,-179.97,-19.05,-86.32,-152.742,42.229,26.47,-158.17,-122.12,158.196,160.27,-68.246,-16.641,155.246,-121.229,112.95,0,-71.729,-22.1,142.5,158.03,157.8,-75.33,42.229,155.246,158.196,140.854,-121.76,-155.608,52.109,-86.32,-19.05,-71.409,-75.363,130.657,157.718,161.36,140.244,-78.815,-153.43,139.394,158.196,158.03,158.836,160.27,160.326,159.674,-19.05,-19.05,-113.5,-69.5,-75.365,-72.439,-61.165,161.36,157.407,158.836,159.45,158.03,140.44,0,138.728,139.963,139.394,140.88,154.808,154.7,144.561,-121.76,-118.32,-122.12,15.213,176.5,175.57,-16.641,-112.08,-69.698,-19.05,-21.32,-78.183,-19.05,-98.032,-152.742,-84.233,157.572,158.836,160.326,140.44,-118.75,12.02,-19.05,-155.608,-120.57,157.718,141.001,160.326,158.03,-122.12,157.407,157.203,158.836,159.97,156.978,140.244,130.862,-19.05,-19.05,-92.109,-19.05,42.229,98.5,-122.08,159.97,159.674,-16.641,-16.78,2.97,141.166,144.443,159.804,160.32,160.27,158.196,-121.688,15.213,-61.165,-72.614,-78.436,14.95,-152.742,141.242,-99.13,-69.142,-19.05,-19.98,-19.7,-155.608,-156.368,157.718,159.674,36.75,142.5,40.48,-156.25,-98.032,-103.62,0,-19.05,-113.5,-122.12,158.196,-152.742,-179.97,-152.742,-92.109,-101.75,-152.742,158.03,140.799,139.27,130.657,-19.05,148.15,158.836,117.77,0,-22.1,161.36,158.196,160.27,139.021,2.97,-156.25,-72.794,-23.78,-19.05,-20.28,-19.17,-84.1,-17.83,-122.193,-110.67,-152.742,-152.251,138.728,139.963,139.285,139.394,160.326,157.328,158.03,15.213,36.23,36.07,36.292,46.77,26.47,174.07,176.25,130.657,176.5,158.836,161.36,-166.923,-122.08,-98.032,12.02,-62.96,-16.78,157.718,-152.742,159.674,140.799,140.281,-19.05,-152.742,15.004,130.592,161.36,-19.05,-78.598,-16.641,117.77,42.229,-97.27,-156.25,-61.165,-19.05,34.52,138.728,140.88,160.27,-155.608,-121.82,-98.622,2.97,130.592,-20.87,-112.08,138.528,0,-152.742,141.001,158.07,14.139,-78.598,-72.614,-168.13,-98.032,155.461,-103.62,0,-71.502,161.36,160.27,140.799,140.072,14.962,130.657,0,-19.05,161.36,0,-78.598,161.36,157.407,138.523,160.32,157.12,141.001,139.526,130.87,-115.616,106.7,-61.664,-61.165,0,42.229,0,-101.75,14.139,161.36,-16.78,-93.228,-75.363,-130.63,-156.368,-155.608,139.394,136.771,138.528,140.839,160.27,158.07,158.05,2.97,14.962,36.33,36.43,-16.641,0,-179.97,138.728,109.92,159.443,161.36,-71.85,-61.165,0,-72.794,-72.81,-78.598,-77.58,-17.53,-166.923,-155.608,-122.193,140.281,139.394,14.139,-72.646,-75.324,160.509,141.166,-71.93,-156.25,-98.032,-97.27,-27.32,0,-25.47,-60.652,-119,129.926,-156.25,-72.614,0,-16.83,-16.78,161.36,160.02,-155.87,-71.183,-130.55,131.6,-70.903,-16.78,-16.641,-71.729,35.48,-98.032,-71.377,-69.83,-78.617,-129.1,14.426,155.62,157.718,159.674,141.38,-20.58,-16.78,0,-119.032,161.36,174.07,-78.598,2.97,120.35,-97.27,-155.27,-121.49,160.08,-131.28,-163.97,144.013,154.808,160.595,157.328,136.771,139.73,130.862,12.02,36.23,176.08,-77.37,-22.23,-61.165,-16.72,-17.53,-112.08,167.17,42.229,140.799,157.407,-17.53,-21.32,46.77,145.964,0,161.36,-155.608,-98.622,139.394,131.249,-71.409,138.523,36.446,-156.25,-152.742,0,-135.75,-72.81,-67.73,-122.193,137.554,140.88,158.03,160.27,-83.767,-16.641,-152.742,174.07,117.77,161.36,-172.51,-177.168,137.59,-86.32,-21.32,138.728,110.442,-61.165,174.07,-99.13,-101.75,-122.193,-121.767,-155.608,36.07,-99.13,-152.742,-155.253,-73.4,-16.78,161.36,-110.67,158.03,-71.729,-82.543,-122.193,-103.62,-164.43,-152.742,-86.32,-73.4,-156.25,152.8,137.587,140.072,120.35,146.994,-61.664,-78.815,161.36,107.6,150.516,-71.93,-97.27,138.728,-155.87,-155.608,161.36,160.53,-163.97,136.771,154.808,157.12,158.196,158.07,159.674,160.509,36.18,13.897,-21.32,-20.28,-20.58,-16.641,-72.614,155.461,176.5,-156.25,42.229,14.139,175.57,-163.589,161.36,160.326,140.44,-165.986,-84.233,0,0,161.36,-122.193,139.394,139.766,174.07,0,-78.436,-103.62,161.36,137.554,36.57,0,2.97,-99.758,-122.193,161.36,130.657,-78.442,-70.85,-72.646,-61.165,-20.87,-71.349,42.229,-152.742,-121.76,-75.33,34.52,138.728,0,2.97,175.57,139.963,140.799,-121.813,161.36,-176.747,-155.608,-16.78,0,-69.5,140.854,157.572,-84.233,-99.13,-72.614,0,-156.25,161.36,0,0,14.139,-72.614,-22.5,-72.97,107.6,139.766,0,0,14.83,-179.97,176.5,36.33,29.45,120.95,131.104,139.153,139.394,140.303,140.281,139.098,158.05,158.28,160.32,160.27,141.16,-121.76,-155.608,-122.193,167.17,-20.28,-78.25,-62.18,130.657,93.858,-123,0,161.36,-72.614,0,176,0,0,-21.32,161.36,-61.165,-72.614,0,-17.33,0,-21.32,-91.17,157.407,140.88,33.554,-113.5,140.799,6.85,-72.614,-21.32,-136,161.36,-114.352,-72.439,161.36,139.394,-23.78,-72.614,14.139,161.36,-22.1,-16.78,155.461,138.728,139.963,-70.903,-19.98,-155.253,-108,-113.5,6.85,130.87,110.442,140.799,-16.75,-21.83,-113.5,131.249,-121.229,176,176,-71.502,-82.543,-152.742,175.632,155.461,-92.109,175.632,176,140.88,157.407,-16.83,130.217,139.494,175.632,175.57,175.57,175.632,42.229,-113.5,124.792],2,null,"Confirmed",{"interactive":true,"className":"","stroke":false,"color":"purple","weight":5,"opacity":0.5,"fill":true,"fillColor":"purple","fillOpacity":0.2},null,null,null,null,null,{"interactive":false,"permanent":false,"direction":"auto","opacity":1,"offset":[0,0],"textsize":"10px","textOnly":false,"className":"","sticky":true},null]},{"method":"addCircleMarkers","args":[[-6.892,-16.507,47.35,30.484,1.38,-39.42,-37.92,56.056,1.22,48.092,52.825,10.025,-16.355,24.751,-4.649,-57.787,46.042,-8.2,-4.649,18.13,-0.171,-37.92,-36.863,-30.543,64.63,-7.542,0.8,2.78,-16.507,54.756,-0.171,-5.05,0.8,12.602,-7.792,64.63,24.285,-8.125,64.63,31.44,46.042,-53.03,11.984,24.751,-8.125,-5.576,-23.37,31.44,25.424,13.257,-0.171,25.424,24.285,-10.38,31.44,-5.519,-8.058,64.63,25.424,31.44,24.417,24.285,25.424,55.417,-23.37,27.247,31.44,25.424,-8.058,54.756,64.63,24.285,-7.242,25.424,12.278,54.756,24.285,25.424,63.63,25.424,31.44,24.285,25.424,-9.02,31.44,24.285,50.861,64.63,38.23,25.424,51.79,-58.42,64.63,52.331,2.3,51.923,0.686,-39.28,31.44,23.5,24.285,-8.42,-8.125,31.44,64.63,52.331,24.285,31.44,4.892,-39.28,31.44,-34.814,-27.109,24.751,31.44,-1.467,-19.75,28.6,-24.29,31.44,23.5,-53.106,31.44,-7.725,64.63,24.285,0.8,-53.998,-55.97,13.891,-24.188,-20.73,52.825,31.44,25.424,31.44,36.618,-16.68,19.514,31.888,18.13,24.417,52.894,12.702,31.888,24.285,-15.78,25.424,-63.001,15,52.103,-29.27,60.032,52.076,64.63,31.888,18.92,6.25,-0.978,26.06,52.381,53.891,24.285,27.247,52.825,27.247,-18.42,-6.77,12.702,20.13,54.049,-74.33,26.06,18.92,64.42,1.358,25.424,31.888,-7.942,-22.4,19.514,27.247,21.93,31.888,55.417,-37.52,25.424,15,27.247,44.353,21.93,56.056,54.756,-9.02,-17.874,21.93,31.888,-16.829,27.247,-65.03,-4.649,20.42,-16.829,31.888,23.078,21.93,54.518,27.247,60.032,21.93,23.5,21.93,31.44,-16.829,23.5,-22.33,24.285,21.93,31.44,-8.242,-8.53,23.5,52.381,21.765,52.825,18.92,31.44,15,27.247,29.794,-16.68,-2.764,3.5,31.44,-23.37,-7.242,9.979,-18.02,24.751,44.353,0.02,55.832,-16.829,-16.68,1.22,19.514,50.861,24.285,-63.001,54.134,-16.68,-16.829,51.577,64.42,-36.863,-37.406,-23.37,-22.55,-16.68,18.92,-8.897,-1.697,31.888,-7.542,50.686,-16.829,-20.32,15,63.88,-2.764,-6.102,-0.381,3.138,24.285,25.424,3.67,38.404,-0.92,24.285,9.979,24.285,45.022,-35.223,-22.33,18.13,37.735,-36.13,63.88,60.485,-36.863,15,38.65,12.506,38.47,24.285,37.125,9.979,24.285,-4.649,11.538,34.724,-5.358,24.285,-39.42,-38.692,-19.15,21.93,24.285,24.417,-18.75,-15.6,21.93,24.285,43.418,53.13,53.637,7.18,-77.53,34.724,-54.408,24.285,36.406,-10.38,-6.77,63.63,24.285,-0.43,31.593,64.42,24.285,61.299,-57.08,24.285,-16.68,37.734,52.825,52.076,25.424,-7.979,60.032,52.381,-7.2,24.285,37.735,36.406,17.32,32.884,21.93,53.891,60.032,52.825,53.93,43.384,56.88,-21.244,-5.05,52.381,58.27,24.285,-39.42,29.859,-21.244,58.27,64.42,1.22,60.032,-15.6,24.417,-3.613,2.3,52.076,31.934,45.389,58.195,64.42,-36.863,42.688,15,46.815,-25.887,-1.467,-7.242,57.18,32.884,-0.677,-5.525,56.88,-8.53,-8.42,19.514,64.42,-3.613,-33.789,12.602,2.3,-38.377,38.144,64.42,36.56,-39.42,-37.92,0.079,-17.72,-5.05,24.417,58.195,-3.613,-30.543,53.43,13.434,42.063,42.063,31.772,34.724,39.853,29.638,31.934,-7.242,60.485,60.032,50.324,-0.538,1.22,50.267,36.618,51.923,18.57,30.443,52.559,49.57,48.092,32.884,58.28,-2.57,-33.789,62.006,1.22,34.9,-17.72,-40.969,-56.712,57.135,58.28,58.195,52.825,-37.406,18.13,52.643,31.772,19.421,9.83,10.082,10.07,64.27,58.195,43.384,38.144,52.315,51.79,52.103,-8.508,-39.157,-63.001,4.769,-8.125,-4.08,19.671,-7.542,53.637,-4.08,-21.88,-36.863,37.615,-39.42,58.28,-20.32,62.006,46.2,13.853,58.28,-3.613,2.32,34.724,12.602,-39.42,-3.52,12.422,2.3,12.602,36.406,-21.88,10.83,7.7,-21.88,29.638,10.463,-15.4,7.7,-42.793,37.735,-37.52,58.28,29.638,9.979,30.789,53.93,-15.42,-35.653,19.523,-39.42,54.756,54.134,53.891,-5.05,37.1,37.734,6.37,41.611,53.256,9.979,-6.137,14.07,9.979,-63.001,-1.52,-37.52,-56.3,53.93,-21.244,-4.92,-34.164,-18.42,-8.676,45.374,62.006,-4.08,52.103,2.32,-1.408,30.443,38.144,18.78,36.406,13.6,52.076,56.58,-4.83,-21.3,46.2,36.406,-35.653,16.044,36.618,13.6,9.203,10.83,-17.026,-4.523,28.6,59.363,-4.08,19.671,17.307,0.8,-77.53,-5.576,13.579,43.979,-1.467,31.593,-8.508,9.979,-30.543,54.756,52.177,59.68,46.2,41.33,38.144,9.203,-3.613,54.756,37.735,38.144,0.8,18.78,53.321,10.882,-20.32,-2.764,-19.18,52.543,9.979,-65.03,38.404,-22.4,-0.39,36.406,36.77,14.797,38,-39.157,38.144,-6.77,9.979,-8.897,-7.942,0.686,-3.613,-8.676,-30.21,17.6,-4.83,-7.143,-37.52,12.422,-3.613,-7.143,-5.519,-37.52,-6.77,14.002,0.8,62.006,63.88,10.412,-4.08,-3.613,48.777,10.412,-3.613,-36.863,9.979,9.979,-21.244,13.853,46.853,-53.106,3.17,-33.425,-34.164,44.133,47.6,13.33,54.756,53.13,9.83,46.853,10.2,-5.519,-0.381,13.494,-49.02,13.853,36.406,52.5,-39.157,-7.93,40.821,13.813,-38.692,52.643,31.44,13.6,-21.244,-29.27,48.75,-37.92,-35.223,42.688,36.799,13.813,-16.294,-21.244,19.475,46.853,-16.25,0.8,-21.88,-16.294,-34.164,48.777,-35.223,45.374,34.724,-0.978,-3.613,48.777,10.135,53.891,14.473,-39.42,19.514,0.686,-8.108,-9.13,-20.32,54.756,48.777,20.538,-37.92,-8.108,0.8,17.6,13.257,0.8,15.043,13.579,-17.026,-37.406,-11.75,54.134,14.473,64.42,10.025,48.777,0.8,0.32,-8.542,0.8,36.571,11.984,7.647,46.853,37.734,27.47,-18.992,40.656,14.583,48.777,53.75,7.647,-37.52,-4.523,52.559,15.132,35.361,-7.542,45.374,0.32,21.83,46.853,52.543,13.434,44.133,45.374,-23.37,55.417,56.17,57.135,57.751,14.583,14.473,19.023,-8.508,12.77,-19.18,12.278,-39.42,-41.1,10.83,40.492,48.777,35.52,14.473,12.602,11.826,-63.579,-7.143,-8.108,-7.93,46.2,-5.519,40.656,-7.542,18.78,-37.406,-8.242,10.025,15.05,48.777,0.8,-6.312,54.134,54.765,9.979,0.8,37.735,53.891,52.381,17.37,14.07,46.853,60.032,-35.223,0.8,-13.8,-15.6,-6.77,-63.001,-37.406,66.67,-3.52,54.134,52.894,18.57,10.2,-34.164,-41.326,34.724,53.256,-0.433,1.22,-43.189,-4.523,-43.497,-41.874,-34.164,-33.425,-43.189,19.023,40.656,4.892,-34.164,-16.294,54.765,-34.164,-8.32,36.77,38.404,54.765,-56.712,-56.3,-16.294,0.8,-4.649,-3.507,56.17,51.93,14.381,52.381,52.076,51.923,-63.001,-22.33,10.07,52.076,52.177,51.79,54.134,19.023,53.891,52.315,52.177,51.923,52.543,34.724,-16.294,4.892,9.979,-16.355,-30.21,54.765,46.853,-5.92,14.797,51.577,39.853,65.43,-56.3,-57.787,38.404,-34.164,0.8,9.979,-8.342,52.559,15.043,1.13,17.307,19.671,62.006,60.485,53.891,52.643,-0.433,37.734,0.8,37.647,44.462,38.404,13.257,13.434,-9.2,12.98,40.656,64.63,13.734,40.656,56.653,11.538,32.761,13.434,-0.85,18.57,-22.4,64.42,54.765,64.42,40.656,27.73,40.656,60.032,48.777,53.891,31.593,51.93,51.885,53.891,53.13,51.93,51.923,54.756,54.134,53.256,-34.164,60.032,41.51,19.671,38.404,14.797,62.006,42.063,53.13,52.076,40.656,66.67,38.961,39.7,40.656,-20.32,0.8,-1.467,-18.02,-17.026,36.406,60.485,-1.467,-7.2,-7.942,38.404,54.756,19.671,11.984,-39.42,-42.793,0.45,14.473,51.93,35.361,37.734,52.5,40.656,51.923,60.032,13.257,-7.942,37.601,31.593,-7.2,14.473,42.063,39.099,51.923,51.885,-0.433,52.076,51.79,14.381,48.98,-37.856,-0.85,-1.467,-7.93,32.884,-7.625,14.473,19.514,27.47,12.602,14.07,21.45,50.267,51.356,-0.85,39.099,33.086,39.099,14.07,-0.481,65.73,-0.85,41.33,37.734,10.025,39.853,37.601,14.381,-54.95,42.063,14.473,34.094,40.656,35.361,32.884,33.137,37.1,-3.608,-3.613,-6.72,3.67,55.832,40.656,37.734,-6.312,38.654,27.73,17.37,32.761,19.671,39.853,14.473,39.853,14.473,14.381,27.73,0.8,40.656,31.44,32.884,31.593,31.934,63.88,-0.85,0.32,32.761,36.406,36.406,13.853,40.492,-42.793,-0.538,0.8,6.013,-7.808,3.67,36.155,-39.42,37.734,13.813,37.734,13.457,35.361,13.853,-3.613,-3.608,-3.507,31.22,-4.523,11.984,12.702,42.544,37.601,37.734,25.23,12.98,12.422,0.32,-14.45,40.656,36.406,19.514,-16.355,-16.294,41.33,41.98,40.656,40.656,-7.97,31.934,37.734,-7.542,-7.45,-8.125,11.984,-0.171,37.734,14.473,-0.171,14.473,-39.42,14.473,14.473,-7.45,11.826,14.473,32.884,35.361,39.099,-0.171,14.473,-8.897,71.087,14.473,37.734,37.734,6.25,-16.294,14.465,4.892,-0.171,-0.171,37.734,-0.171,-0.171,36.406,18.57,37.734,19.03,-0.171,36.406,10.83,14.473,13.853,36.406,19.023,-7.93,39.099,37.734,14.4,39.7,28.271,28.271,36.406,35.361,41.98,28.271,32.884,32.884,31.934,32.884,19.023,19.03,38.144,40.821,32.884,28.271,37.734,38.144,37.734,48.112,23.08,36.406,40.821,36.56,32.884,37.734,19.03,36.155,31.934,37.734,37.734,19.03,36.406,34.724,40.821,19.85,40.821,37.734,35.361,-7.542,37.734,63.63,39.099,35.361,32.884,35.361,15.55,39.099,34.724,39.099,37.734,63.63,36.155,36.406,39.099,36.155,31.22,31.22,39.099,31.22,32.761,37.734,36.155,39.099,39.099,36.155,-7.25,39.099,34.219,37.734,37.734,39.964,39.099,32.884,35.893,38.144,39.704,39.099,31.593,36.571,37.734,39.099,37.734,39.099,39.099,37.734,32.884,40.821,37.734,37.734,37.734,40.821,38.52,-7.62,37.734,44.044,37.734,37.734,40.73,37.734,36.404,37.734,38.404,38.404,56.653,37.734,37.734,41.73,37.734,41.73,37.734,41.73,37.734,40.028,41.98,13.734,37.734,16.044,56.653,38.13,38.13,48.112],[108.4,168.346,152.475,140.303,127.53,-71.93,-71.45,160.642,-77.37,153.2,-169.944,-83.767,-70.903,141.289,145.964,-26.46,150.05,119.07,145.964,145.8,-78.598,-71.45,-71.377,-178.556,-17.53,110.442,127.33,125.4,168.346,-163.97,-78.598,151.33,127.33,-86.845,123.579,-17.53,141.481,114.042,-17.53,140.051,150.05,72.6,-86.161,141.289,114.042,150.516,-67.73,140.051,141.284,123.685,-78.598,141.284,141.481,165.8,140.051,148.115,114.242,-17.53,141.284,140.051,141.417,141.481,141.284,-161.894,-67.73,140.874,140.051,141.284,114.242,-163.97,-17.53,141.481,109.208,141.284,93.858,-163.97,141.481,141.284,-19.05,141.284,140.051,141.481,141.284,157.95,140.051,141.481,155.565,-17.53,-26.63,141.284,-178.794,-26.33,-17.53,-174.139,125.37,-177.168,99.539,175.57,140.051,141.935,141.481,116.47,114.042,140.051,-17.53,-174.139,141.481,140.051,-75.324,175.57,140.051,-70.352,-68.541,141.289,140.051,-78.442,-175.07,61.13,-67.783,140.051,141.935,73.513,140.051,112.58,-17.53,141.481,127.33,-139.845,-143.17,-89.786,-68.054,-68.55,-169.944,140.051,141.284,140.051,138.528,168.37,-103.62,139.918,145.8,141.417,-170.054,-87.004,139.918,141.481,-71.85,141.284,-60.652,145.25,177.602,-177.92,-153.09,-176.13,-17.53,139.918,-155.27,10.5,100.679,140.933,-174.166,-166.923,141.481,140.874,-169.944,140.874,-69.092,107.6,-87.004,145.1,159.443,-99.42,140.933,-155.27,-17.33,124.792,141.284,139.918,112.95,172.05,-103.62,140.874,143.47,139.918,-161.894,177.18,141.284,145.25,140.874,146.252,143.47,160.642,-163.97,157.95,-148.068,143.47,139.918,168.536,140.874,-60.05,145.964,145.03,168.536,139.918,142.326,143.47,-164.65,140.874,-153.09,143.47,141.935,143.47,140.051,168.536,141.935,171.32,141.481,143.47,140.051,115.375,123.57,141.935,-174.166,143.71,-169.944,-155.27,140.051,145.25,140.874,140.342,168.37,35.914,36.042,140.051,-67.73,109.208,-83.852,-174.325,141.289,146.252,-91.35,160.326,168.536,168.37,-77.37,-103.62,155.565,141.481,-60.652,-165.986,168.37,168.536,157.328,-17.33,-71.377,-71.349,-67.73,-67.85,168.37,-155.27,121.645,101.264,139.918,110.442,156.014,168.536,-175.42,145.25,-22.5,35.914,105.423,100.473,125.491,141.481,141.284,125.5,14.962,-91.408,141.481,-83.852,141.481,147.019,-70.568,171.32,145.8,140.244,178.05,-22.5,-152.742,-71.377,145.25,-28.08,-86.702,-28.4,141.481,139.963,-83.852,141.481,145.964,-85.622,139.394,147.12,141.481,-71.93,-71.729,-68.83,143.47,141.481,141.417,169.23,-175.63,143.47,141.481,142.686,-168.693,158.922,38.43,167.17,139.394,3.351,141.481,138.523,165.8,106.965,-19.05,141.481,-91.12,130.657,-17.33,141.481,-152.251,-26.67,141.481,168.37,15.004,-169.944,-176.13,141.284,113.342,-153.09,-174.166,109.92,141.481,140.244,138.523,121.1,131.104,143.47,-166.923,-153.09,-169.944,-168.03,144.013,-158.17,55.708,151.33,-174.166,-155.157,141.481,-71.93,129.857,55.708,-155.157,-17.33,-77.37,-153.09,-175.63,141.417,144.818,125.37,-176.13,130.862,148.838,-155.253,-17.33,-71.377,141.38,145.25,151.786,-177.188,-78.442,109.208,-170.3,131.104,-78.436,148.42,-158.17,123.57,116.47,-103.62,-17.33,144.818,-69.895,-86.845,125.37,-71.58,140.44,-17.33,139.193,-71.93,-71.45,99.98,-69.77,151.33,141.417,-155.253,144.818,-178.556,-168.13,-88.269,140.677,140.677,-113.498,139.394,141.001,129.714,130.862,109.208,-152.742,-153.09,155.461,-77.626,-77.37,155.246,138.528,-177.168,-95.2,130.217,158.03,154.808,153.2,131.104,-154.963,147.28,-69.895,-144.017,-77.37,139.098,-69.77,-72.264,-27.176,-156.99,-154.963,-155.253,-169.944,-71.349,145.8,-170.629,-113.498,-155.287,109.05,40.702,40.84,-16.65,-155.253,144.013,140.44,-172.51,-178.794,177.602,124.13,175.632,-60.652,96.821,114.042,145.037,145.406,110.442,158.922,145.037,-68.4,-71.377,23.336,-71.93,-154.963,-175.42,-144.017,-122.18,-89.63,-154.963,144.818,36.57,139.394,-86.845,-71.93,102.62,-86.54,125.37,-86.845,138.523,-68.4,-85.324,124.5,-68.4,129.714,-84.703,167.83,124.5,-72.439,140.244,177.18,-154.963,129.714,-83.852,130.308,-168.03,-72.33,-70.761,121.94,-71.93,-163.97,-165.986,-166.923,151.33,12.7,15.004,125.07,-121.554,158.836,-83.852,155.196,121.48,-83.852,-60.652,29.25,177.18,-27.57,-168.03,55.708,151.158,-69.832,-69.092,122.455,-121.695,-144.017,145.037,177.602,36.57,29.2,130.217,140.44,-110.95,138.523,40.67,-176.13,-130.55,103.92,-68.18,-122.18,138.523,-70.761,-61.664,138.528,40.67,124.673,-85.324,-70.372,129.881,61.13,-153.43,145.037,145.406,145.845,127.33,167.17,150.516,41.809,145.733,-78.442,130.657,124.13,-83.852,-178.556,-163.97,-175.508,-133.32,-122.18,128,140.44,124.673,144.818,-163.97,140.244,140.44,127.33,-110.95,158.712,124.888,-175.42,35.914,-174.87,157.339,-83.852,-60.05,14.962,172.05,100.331,138.523,12.02,-91.519,-119.03,175.632,140.44,106.965,-83.852,121.645,112.95,99.539,144.818,122.455,-178.475,145.83,103.92,107.84,177.18,-86.54,144.818,107.84,148.115,177.18,106.965,120.993,127.33,-144.017,-22.5,123.132,145.037,144.818,-121.813,123.132,144.818,-71.377,-83.852,-83.852,55.708,-89.63,-121.76,73.513,98.392,-69.797,-69.832,145.161,152.92,-61.18,-163.97,-168.693,109.05,-121.76,-84.233,148.115,100.473,-88.502,-73.55,-89.63,138.523,-171.252,175.632,112.308,14.426,-89.633,-71.729,-170.629,140.051,40.67,55.708,-177.92,154.02,-71.45,-70.568,141.38,139.376,-89.633,-71.409,55.708,-155.608,-121.76,168.12,127.33,-68.4,-71.409,-69.832,-121.813,-70.568,-121.695,139.394,100.679,144.818,-121.813,-84.1,-166.923,-90.88,-71.93,-103.62,99.539,112.92,159.82,-175.42,-163.97,-121.813,144.896,-71.45,112.92,127.33,145.83,123.685,127.33,-91.903,41.809,-70.372,-71.349,43.38,-165.986,-90.88,-17.33,-83.767,-121.813,127.33,127.4,122.775,127.33,137.59,-86.161,124.32,-121.76,15.004,-112.591,-174.775,140.303,-91.186,-121.813,158.45,124.32,177.18,129.881,158.03,-92.109,138.728,110.442,-121.695,127.4,121.18,-121.76,157.339,-88.269,-121.767,-121.695,-67.73,-161.894,-159.38,-156.99,-156.368,-91.186,-90.88,-98.622,124.13,124.05,-174.87,93.858,-71.93,-72.493,-85.324,-121.508,-121.813,80.2,-90.88,-86.845,-85.968,-55.78,107.84,112.92,112.308,-122.18,148.115,140.303,110.442,-110.95,-71.349,115.375,-83.767,42.18,-121.813,127.33,130.017,-165.986,-163.723,-83.852,127.33,140.244,-166.923,-174.166,-62.8,121.48,-121.76,-153.09,-70.568,127.33,167.47,-175.63,106.965,-60.652,-71.349,-18.5,102.62,-165.986,-170.054,-95.2,-84.233,-69.832,-72.614,139.394,158.836,-19.596,-77.37,-72.794,129.881,-72.81,-72.431,-69.832,-69.797,-72.794,-98.622,140.303,-75.324,-69.832,-71.409,-163.723,-69.832,121.708,12.02,14.962,-163.723,-27.176,-27.57,-71.409,127.33,145.964,144.605,-159.38,179.58,-90.601,-174.166,-176.13,-177.168,-60.652,171.32,40.84,-176.13,-175.508,-178.794,-165.986,-98.622,-166.923,-172.51,-175.508,-177.168,157.339,139.394,-71.409,-75.324,-83.852,-70.903,-178.475,-163.723,-121.76,154.98,-91.519,157.328,141.001,-16.65,-27.57,-26.46,14.962,-69.832,127.33,-83.852,115.508,158.03,-91.903,124.758,145.845,145.406,-144.017,-152.742,-166.923,-170.629,-19.596,15.004,127.33,140.281,146.932,14.962,123.685,-88.269,149.07,-87.57,140.303,-17.53,-89.294,140.303,161.36,-85.622,130.299,-88.269,-78.9,-95.2,172.05,-17.33,-163.723,-17.33,140.303,-18.03,140.303,-153.09,-121.813,-166.923,130.657,179.58,-178.146,-166.923,-168.693,179.58,-177.168,-163.97,-165.986,158.836,-69.832,-153.09,139.367,145.406,14.962,-91.519,-144.017,140.677,-168.693,-176.13,140.303,-18.5,140.788,44.3,140.303,-175.42,127.33,-78.442,-174.325,-70.372,138.523,-152.742,-78.442,109.92,112.95,14.962,-163.97,145.406,-86.161,-71.93,-72.439,127.4,-90.88,179.58,138.728,15.004,-171.252,140.303,-177.168,-153.09,123.685,112.95,140.072,130.657,109.92,-90.88,140.677,140.049,-177.168,-178.146,-19.596,-176.13,-178.794,-90.601,153.48,-71.183,-78.9,-78.442,112.308,131.104,111.192,-90.88,-103.62,-112.591,-86.845,121.48,-104.73,155.246,156.753,-78.9,140.049,131.249,140.049,121.48,-78.141,-16.78,-78.9,128,15.004,-83.767,141.001,140.072,-90.601,-70.25,140.677,-90.88,139.526,140.303,138.728,131.104,139.766,12.7,144.588,144.818,106.73,125.5,160.326,140.303,15.004,130.017,42.229,-18.03,-62.8,130.299,145.406,141.001,-90.88,141.001,-90.88,-90.601,-18.03,127.33,140.303,140.051,131.104,130.657,130.862,-22.5,-78.9,127.4,130.299,138.523,138.523,-89.63,-121.508,-72.439,-77.626,127.33,121.057,111.758,125.5,136.771,-71.93,15.004,-89.633,15.004,123.457,138.728,-89.63,144.818,144.588,144.605,130.57,129.881,-86.161,-87.004,140.839,140.072,15.004,98.5,-87.57,-86.54,127.4,168.05,140.303,138.523,-103.62,-70.903,-71.409,128,128.08,140.303,140.303,113.57,130.862,15.004,110.442,110.43,114.042,-86.161,-78.598,15.004,-90.88,-78.598,-90.88,-71.93,-90.88,-90.88,110.43,-85.968,-90.88,131.104,138.728,140.049,-78.598,-90.88,121.645,-8.146,-90.88,15.004,15.004,10.5,-71.409,-90.743,-75.324,-78.598,-78.598,15.004,-78.598,-78.598,138.523,-95.2,15.004,-97.27,-78.598,138.523,-85.324,-90.88,-89.63,138.523,-98.622,112.308,140.049,15.004,-89.78,44.3,-16.641,-16.641,138.523,138.728,128.08,-16.641,131.104,131.104,130.862,131.104,-98.622,-97.27,140.44,14.426,131.104,-16.641,15.004,140.44,15.004,-121.113,39.78,138.523,14.426,139.193,131.104,15.004,-97.27,136.771,130.862,15.004,15.004,-97.27,138.523,139.394,14.426,-101.75,14.426,15.004,138.728,110.442,15.004,-19.05,140.049,138.728,131.104,138.728,50.63,140.049,139.394,140.049,15.004,-19.05,136.771,138.523,140.049,136.771,130.57,130.57,140.049,130.57,130.299,15.004,136.771,140.049,140.049,136.771,108.058,140.049,139.153,15.004,15.004,140.757,140.049,131.104,137.48,140.44,45.551,140.049,130.657,137.59,15.004,140.049,15.004,140.049,140.049,15.004,131.104,14.426,15.004,15.004,15.004,14.426,35.48,112.63,15.004,145.086,15.004,15.004,13.897,15.004,25.396,15.004,14.962,14.962,161.36,15.004,15.004,12.7,15.004,12.7,15.004,12.7,15.004,45.74,128.08,-89.294,15.004,-61.664,161.36,34.17,34.17,-121.113],2,null,"Not Confirmed",{"interactive":true,"className":"","stroke":false,"color":"red","weight":5,"opacity":0.5,"fill":true,"fillColor":"red","fillOpacity":0.2},null,null,null,null,null,{"interactive":false,"permanent":false,"direction":"auto","opacity":1,"offset":[0,0],"textsize":"10px","textOnly":false,"className":"","sticky":true},null]},{"method":"addLayersControl","args":[[],["Confirmed","Not Confirmed"],{"collapsed":false,"autoZIndex":true,"position":"topright"}]}],"limits":{"lat":[-77.53,85.608],"lng":[-179.97,179.58]}},"evals":[],"jsHooks":[]}</script> --- ## `plotly` * Also a JavaScript library ```r library(plotly) ggplotly(p) ``` <div id="htmlwidget-28e99d451871e10ae5d8" style="width:576px;height:360px;" class="plotly html-widget"></div> <script type="application/json" data-for="htmlwidget-28e99d451871e10ae5d8">{"x":{"data":[{"x":[1880,1881,1882,1883,1884,1885,1886,1887,1888,1889,1890,1891,1892,1893,1894,1895,1896,1897,1898,1899,1900,1901,1902,1903,1904,1905,1906,1907,1908,1909,1910,1911,1912,1913,1914,1915,1916,1917,1918,1919,1920,1921,1922,1923,1924,1925,1926,1927,1928,1929,1930,1931,1932,1933,1934,1935,1936,1937,1938,1939,1940,1941,1942,1943,1944,1945,1946,1947,1948,1949,1950,1951,1952,1953,1954,1955,1956,1957,1958,1959,1960,1961,1962,1963,1964,1965,1966,1967,1968,1969,1970,1971,1972,1973,1974,1975,1976,1977,1978,1979,1980,1981,1982,1983,1984,1985,1986,1987,1988,1989,1990,1991,1992,1993,1994,1995,1996,1997,1998,1999,2000,2001,2002,2003,2004,2005,2006,2007,2008,2009,2010,2011,2012,2013,2014,2015,2016,2017],"y":[7,7,8,6,14,6,11,8,18,9,18,14,14,15,10,19,9,9,13,14,23,8,9,16,16,17,18,17,17,18,28,21,36,25,42,55,53,55,56,40,43,48,40,52,41,34,35,39,36,42,38,39,44,43,46,47,43,72,50,77,61,81,127,121,124,132,240,430,482,406,402,466,452,495,424,386,406,476,529,522,559,668,865,1126,1178,1537,1677,1773,1840,2505,4038,5379,6234,7246,10696,12979,18424,24934,26198,27890,34049,42699,45634,45476,46035,48575,52891,56234,51763,48137,46615,43518,38455,35088,32222,27986,24241,21088,18265,16376,15736,13947,11935,10465,9506,8130,6820,5721,4741,3806,3202,2629,2332,1947,1796,1585,1384,1271],"text":["name: jessica<br />year: 1880<br />n: 7","name: jessica<br />year: 1881<br />n: 7","name: jessica<br />year: 1882<br />n: 8","name: jessica<br />year: 1883<br />n: 6","name: jessica<br />year: 1884<br />n: 14","name: jessica<br />year: 1885<br />n: 6","name: jessica<br />year: 1886<br />n: 11","name: jessica<br />year: 1887<br />n: 8","name: jessica<br />year: 1888<br />n: 18","name: jessica<br />year: 1889<br />n: 9","name: jessica<br />year: 1890<br />n: 18","name: jessica<br />year: 1891<br />n: 14","name: jessica<br />year: 1892<br />n: 14","name: jessica<br />year: 1893<br />n: 15","name: jessica<br />year: 1894<br />n: 10","name: jessica<br />year: 1895<br />n: 19","name: jessica<br />year: 1896<br />n: 9","name: jessica<br />year: 1897<br />n: 9","name: jessica<br />year: 1898<br />n: 13","name: jessica<br />year: 1899<br />n: 14","name: jessica<br />year: 1900<br />n: 23","name: jessica<br />year: 1901<br />n: 8","name: jessica<br />year: 1902<br />n: 9","name: jessica<br />year: 1903<br />n: 16","name: jessica<br />year: 1904<br />n: 16","name: jessica<br />year: 1905<br />n: 17","name: jessica<br />year: 1906<br />n: 18","name: jessica<br />year: 1907<br />n: 17","name: jessica<br />year: 1908<br />n: 17","name: jessica<br />year: 1909<br />n: 18","name: jessica<br />year: 1910<br />n: 28","name: jessica<br />year: 1911<br />n: 21","name: jessica<br />year: 1912<br />n: 36","name: jessica<br />year: 1913<br />n: 25","name: jessica<br />year: 1914<br />n: 42","name: jessica<br />year: 1915<br />n: 55","name: jessica<br />year: 1916<br />n: 53","name: jessica<br />year: 1917<br />n: 55","name: jessica<br />year: 1918<br />n: 56","name: jessica<br />year: 1919<br />n: 40","name: jessica<br />year: 1920<br />n: 43","name: jessica<br />year: 1921<br />n: 48","name: jessica<br />year: 1922<br />n: 40","name: jessica<br />year: 1923<br />n: 52","name: jessica<br />year: 1924<br />n: 41","name: jessica<br />year: 1925<br />n: 34","name: jessica<br />year: 1926<br />n: 35","name: jessica<br />year: 1927<br />n: 39","name: jessica<br />year: 1928<br />n: 36","name: jessica<br />year: 1929<br />n: 42","name: jessica<br />year: 1930<br />n: 38","name: jessica<br />year: 1931<br />n: 39","name: jessica<br />year: 1932<br />n: 44","name: jessica<br />year: 1933<br />n: 43","name: jessica<br />year: 1934<br />n: 46","name: jessica<br />year: 1935<br />n: 47","name: jessica<br />year: 1936<br />n: 43","name: jessica<br />year: 1937<br />n: 72","name: jessica<br />year: 1938<br />n: 50","name: jessica<br />year: 1939<br />n: 77","name: jessica<br />year: 1940<br />n: 61","name: jessica<br />year: 1941<br />n: 81","name: jessica<br />year: 1942<br />n: 127","name: jessica<br />year: 1943<br />n: 121","name: jessica<br />year: 1944<br />n: 124","name: jessica<br />year: 1945<br />n: 132","name: jessica<br />year: 1946<br />n: 240","name: jessica<br />year: 1947<br />n: 430","name: jessica<br />year: 1948<br />n: 482","name: jessica<br />year: 1949<br />n: 406","name: jessica<br />year: 1950<br />n: 402","name: jessica<br />year: 1951<br />n: 466","name: jessica<br />year: 1952<br />n: 452","name: jessica<br />year: 1953<br />n: 495","name: jessica<br />year: 1954<br />n: 424","name: jessica<br />year: 1955<br />n: 386","name: jessica<br />year: 1956<br />n: 406","name: jessica<br />year: 1957<br />n: 476","name: jessica<br />year: 1958<br />n: 529","name: jessica<br />year: 1959<br />n: 522","name: jessica<br />year: 1960<br />n: 559","name: jessica<br />year: 1961<br />n: 668","name: jessica<br />year: 1962<br />n: 865","name: jessica<br />year: 1963<br />n: 1126","name: jessica<br />year: 1964<br />n: 1178","name: jessica<br />year: 1965<br />n: 1537","name: jessica<br />year: 1966<br />n: 1677","name: jessica<br />year: 1967<br />n: 1773","name: jessica<br />year: 1968<br />n: 1840","name: jessica<br />year: 1969<br />n: 2505","name: jessica<br />year: 1970<br />n: 4038","name: jessica<br />year: 1971<br />n: 5379","name: jessica<br />year: 1972<br />n: 6234","name: jessica<br />year: 1973<br />n: 7246","name: jessica<br />year: 1974<br />n: 10696","name: jessica<br />year: 1975<br />n: 12979","name: jessica<br />year: 1976<br />n: 18424","name: jessica<br />year: 1977<br />n: 24934","name: jessica<br />year: 1978<br />n: 26198","name: jessica<br />year: 1979<br />n: 27890","name: jessica<br />year: 1980<br />n: 34049","name: jessica<br />year: 1981<br />n: 42699","name: jessica<br />year: 1982<br />n: 45634","name: jessica<br />year: 1983<br />n: 45476","name: jessica<br />year: 1984<br />n: 46035","name: jessica<br />year: 1985<br />n: 48575","name: jessica<br />year: 1986<br />n: 52891","name: jessica<br />year: 1987<br />n: 56234","name: jessica<br />year: 1988<br />n: 51763","name: jessica<br />year: 1989<br />n: 48137","name: jessica<br />year: 1990<br />n: 46615","name: jessica<br />year: 1991<br />n: 43518","name: jessica<br />year: 1992<br />n: 38455","name: jessica<br />year: 1993<br />n: 35088","name: jessica<br />year: 1994<br />n: 32222","name: jessica<br />year: 1995<br />n: 27986","name: jessica<br />year: 1996<br />n: 24241","name: jessica<br />year: 1997<br />n: 21088","name: jessica<br />year: 1998<br />n: 18265","name: jessica<br />year: 1999<br />n: 16376","name: jessica<br />year: 2000<br />n: 15736","name: jessica<br />year: 2001<br />n: 13947","name: jessica<br />year: 2002<br />n: 11935","name: jessica<br />year: 2003<br />n: 10465","name: jessica<br />year: 2004<br />n: 9506","name: jessica<br />year: 2005<br />n: 8130","name: jessica<br />year: 2006<br />n: 6820","name: jessica<br />year: 2007<br />n: 5721","name: jessica<br />year: 2008<br />n: 4741","name: jessica<br />year: 2009<br />n: 3806","name: jessica<br />year: 2010<br />n: 3202","name: jessica<br />year: 2011<br />n: 2629","name: jessica<br />year: 2012<br />n: 2332","name: jessica<br />year: 2013<br />n: 1947","name: jessica<br />year: 2014<br />n: 1796","name: jessica<br />year: 2015<br />n: 1585","name: jessica<br />year: 2016<br />n: 1384","name: jessica<br />year: 2017<br />n: 1271"],"type":"scatter","mode":"lines","line":{"width":7.55905511811024,"color":"rgba(248,118,109,1)","dash":"solid"},"hoveron":"points","name":"jessica","legendgroup":"jessica","showlegend":true,"xaxis":"x","yaxis":"y","hoverinfo":"text","frame":null},{"x":[1880,1881,1882,1883,1884,1885,1886,1887,1888,1889,1890,1891,1892,1893,1894,1895,1896,1897,1898,1899,1900,1901,1902,1903,1904,1905,1906,1907,1908,1909,1910,1911,1912,1913,1914,1915,1916,1917,1918,1919,1920,1921,1922,1923,1924,1925,1926,1927,1928,1929,1930,1931,1932,1933,1934,1935,1936,1937,1938,1939,1940,1941,1942,1943,1944,1945,1946,1947,1948,1949,1950,1951,1952,1953,1954,1955,1956,1957,1958,1959,1960,1961,1962,1963,1964,1965,1966,1967,1968,1969,1970,1971,1972,1973,1974,1975,1976,1977,1978,1979,1980,1981,1982,1983,1984,1985,1986,1987,1988,1989,1990,1991,1992,1993,1994,1995,1996,1997,1998,1999,2000,2001,2002,2003,2004,2005,2006,2007,2008,2009,2010,2011,2012,2013,2014,2015,2016,2017],"y":[57,40,50,55,41,43,55,41,50,33,24,24,41,23,24,29,30,29,39,24,36,22,17,21,19,18,27,26,29,28,44,43,60,78,87,136,99,122,118,139,128,125,124,129,114,109,105,117,118,74,90,95,111,102,106,80,100,92,72,101,90,93,112,95,104,97,113,141,130,183,162,164,178,167,191,244,241,272,276,327,314,354,335,373,392,463,487,563,735,1330,2185,3668,5061,8101,11662,14667,16962,22190,25358,31345,36282,39293,38268,36937,40523,42471,37845,40268,42947,44297,43382,41359,36338,33692,31449,30779,29244,28344,28139,27320,27592,26061,26032,25136,24319,23291,22348,20688,19225,17668,15451,13788,12670,11835,10899,9800,9200,8251],"text":["name: joshua<br />year: 1880<br />n: 57","name: joshua<br />year: 1881<br />n: 40","name: joshua<br />year: 1882<br />n: 50","name: joshua<br />year: 1883<br />n: 55","name: joshua<br />year: 1884<br />n: 41","name: joshua<br />year: 1885<br />n: 43","name: joshua<br />year: 1886<br />n: 55","name: joshua<br />year: 1887<br />n: 41","name: joshua<br />year: 1888<br />n: 50","name: joshua<br />year: 1889<br />n: 33","name: joshua<br />year: 1890<br />n: 24","name: joshua<br />year: 1891<br />n: 24","name: joshua<br />year: 1892<br />n: 41","name: joshua<br />year: 1893<br />n: 23","name: joshua<br />year: 1894<br />n: 24","name: joshua<br />year: 1895<br />n: 29","name: joshua<br />year: 1896<br />n: 30","name: joshua<br />year: 1897<br />n: 29","name: joshua<br />year: 1898<br />n: 39","name: joshua<br />year: 1899<br />n: 24","name: joshua<br />year: 1900<br />n: 36","name: joshua<br />year: 1901<br />n: 22","name: joshua<br />year: 1902<br />n: 17","name: joshua<br />year: 1903<br />n: 21","name: joshua<br />year: 1904<br />n: 19","name: joshua<br />year: 1905<br />n: 18","name: joshua<br />year: 1906<br />n: 27","name: joshua<br />year: 1907<br />n: 26","name: joshua<br />year: 1908<br />n: 29","name: joshua<br />year: 1909<br />n: 28","name: joshua<br />year: 1910<br />n: 44","name: joshua<br />year: 1911<br />n: 43","name: joshua<br />year: 1912<br />n: 60","name: joshua<br />year: 1913<br />n: 78","name: joshua<br />year: 1914<br />n: 87","name: joshua<br />year: 1915<br />n: 136","name: joshua<br />year: 1916<br />n: 99","name: joshua<br />year: 1917<br />n: 122","name: joshua<br />year: 1918<br />n: 118","name: joshua<br />year: 1919<br />n: 139","name: joshua<br />year: 1920<br />n: 128","name: joshua<br />year: 1921<br />n: 125","name: joshua<br />year: 1922<br />n: 124","name: joshua<br />year: 1923<br />n: 129","name: joshua<br />year: 1924<br />n: 114","name: joshua<br />year: 1925<br />n: 109","name: joshua<br />year: 1926<br />n: 105","name: joshua<br />year: 1927<br />n: 117","name: joshua<br />year: 1928<br />n: 118","name: joshua<br />year: 1929<br />n: 74","name: joshua<br />year: 1930<br />n: 90","name: joshua<br />year: 1931<br />n: 95","name: joshua<br />year: 1932<br />n: 111","name: joshua<br />year: 1933<br />n: 102","name: joshua<br />year: 1934<br />n: 106","name: joshua<br />year: 1935<br />n: 80","name: joshua<br />year: 1936<br />n: 100","name: joshua<br />year: 1937<br />n: 92","name: joshua<br />year: 1938<br />n: 72","name: joshua<br />year: 1939<br />n: 101","name: joshua<br />year: 1940<br />n: 90","name: joshua<br />year: 1941<br />n: 93","name: joshua<br />year: 1942<br />n: 112","name: joshua<br />year: 1943<br />n: 95","name: joshua<br />year: 1944<br />n: 104","name: joshua<br />year: 1945<br />n: 97","name: joshua<br />year: 1946<br />n: 113","name: joshua<br />year: 1947<br />n: 141","name: joshua<br />year: 1948<br />n: 130","name: joshua<br />year: 1949<br />n: 183","name: joshua<br />year: 1950<br />n: 162","name: joshua<br />year: 1951<br />n: 164","name: joshua<br />year: 1952<br />n: 178","name: joshua<br />year: 1953<br />n: 167","name: joshua<br />year: 1954<br />n: 191","name: joshua<br />year: 1955<br />n: 244","name: joshua<br />year: 1956<br />n: 241","name: joshua<br />year: 1957<br />n: 272","name: joshua<br />year: 1958<br />n: 276","name: joshua<br />year: 1959<br />n: 327","name: joshua<br />year: 1960<br />n: 314","name: joshua<br />year: 1961<br />n: 354","name: joshua<br />year: 1962<br />n: 335","name: joshua<br />year: 1963<br />n: 373","name: joshua<br />year: 1964<br />n: 392","name: joshua<br />year: 1965<br />n: 463","name: joshua<br />year: 1966<br />n: 487","name: joshua<br />year: 1967<br />n: 563","name: joshua<br />year: 1968<br />n: 735","name: joshua<br />year: 1969<br />n: 1330","name: joshua<br />year: 1970<br />n: 2185","name: joshua<br />year: 1971<br />n: 3668","name: joshua<br />year: 1972<br />n: 5061","name: joshua<br />year: 1973<br />n: 8101","name: joshua<br />year: 1974<br />n: 11662","name: joshua<br />year: 1975<br />n: 14667","name: joshua<br />year: 1976<br />n: 16962","name: joshua<br />year: 1977<br />n: 22190","name: joshua<br />year: 1978<br />n: 25358","name: joshua<br />year: 1979<br />n: 31345","name: joshua<br />year: 1980<br />n: 36282","name: joshua<br />year: 1981<br />n: 39293","name: joshua<br />year: 1982<br />n: 38268","name: joshua<br />year: 1983<br />n: 36937","name: joshua<br />year: 1984<br />n: 40523","name: joshua<br />year: 1985<br />n: 42471","name: joshua<br />year: 1986<br />n: 37845","name: joshua<br />year: 1987<br />n: 40268","name: joshua<br />year: 1988<br />n: 42947","name: joshua<br />year: 1989<br />n: 44297","name: joshua<br />year: 1990<br />n: 43382","name: joshua<br />year: 1991<br />n: 41359","name: joshua<br />year: 1992<br />n: 36338","name: joshua<br />year: 1993<br />n: 33692","name: joshua<br />year: 1994<br />n: 31449","name: joshua<br />year: 1995<br />n: 30779","name: joshua<br />year: 1996<br />n: 29244","name: joshua<br />year: 1997<br />n: 28344","name: joshua<br />year: 1998<br />n: 28139","name: joshua<br />year: 1999<br />n: 27320","name: joshua<br />year: 2000<br />n: 27592","name: joshua<br />year: 2001<br />n: 26061","name: joshua<br />year: 2002<br />n: 26032","name: joshua<br />year: 2003<br />n: 25136","name: joshua<br />year: 2004<br />n: 24319","name: joshua<br />year: 2005<br />n: 23291","name: joshua<br />year: 2006<br />n: 22348","name: joshua<br />year: 2007<br />n: 20688","name: joshua<br />year: 2008<br />n: 19225","name: joshua<br />year: 2009<br />n: 17668","name: joshua<br />year: 2010<br />n: 15451","name: joshua<br />year: 2011<br />n: 13788","name: joshua<br />year: 2012<br />n: 12670","name: joshua<br />year: 2013<br />n: 11835","name: joshua<br />year: 2014<br />n: 10899","name: joshua<br />year: 2015<br />n: 9800","name: joshua<br />year: 2016<br />n: 9200","name: joshua<br />year: 2017<br />n: 8251"],"type":"scatter","mode":"lines","line":{"width":7.55905511811024,"color":"rgba(163,165,0,1)","dash":"solid"},"hoveron":"points","name":"joshua","legendgroup":"joshua","showlegend":true,"xaxis":"x","yaxis":"y","hoverinfo":"text","frame":null},{"x":[1880,1881,1882,1883,1884,1885,1886,1887,1888,1889,1890,1891,1892,1893,1894,1895,1896,1897,1898,1899,1900,1901,1902,1903,1904,1905,1906,1907,1908,1909,1910,1911,1912,1913,1914,1915,1916,1917,1918,1919,1920,1921,1922,1923,1924,1925,1926,1927,1928,1929,1930,1931,1932,1933,1934,1935,1936,1937,1938,1939,1940,1941,1942,1943,1944,1945,1946,1947,1948,1949,1950,1951,1952,1953,1954,1955,1956,1957,1958,1959,1960,1961,1962,1963,1964,1965,1966,1967,1968,1969,1970,1971,1972,1973,1974,1975,1976,1977,1978,1979,1980,1981,1982,1983,1984,1985,1986,1987,1988,1989,1990,1991,1992,1993,1994,1995,1996,1997,1998,1999,2000,2001,2002,2003,2004,2005,2006,2007,2008,2009,2010,2011,2012,2013,2014,2015,2016,2017],"y":[27,38,36,49,33,60,49,50,77,74,54,78,83,82,94,96,104,81,102,98,125,86,91,90,101,105,98,102,93,105,137,130,189,238,219,290,297,291,322,282,349,367,365,423,454,444,479,516,554,516,492,534,780,795,1000,1206,2448,4399,7074,10758,18427,23800,31732,38575,38525,41572,52826,99901,96417,91185,80562,74097,67225,61389,55497,51395,48172,44618,41994,40532,37410,35663,31551,27802,23728,19398,15614,13231,11409,10297,8769,7402,5776,4750,4102,3543,3152,2931,2950,2755,2823,2746,2806,2498,2346,2125,1973,1945,1853,1860,1670,1618,1592,1495,1294,1234,987,1098,971,900,850,837,769,741,727,749,700,660,613,551,477,489,448,443,470,425,436,404],"text":["name: linda<br />year: 1880<br />n: 27","name: linda<br />year: 1881<br />n: 38","name: linda<br />year: 1882<br />n: 36","name: linda<br />year: 1883<br />n: 49","name: linda<br />year: 1884<br />n: 33","name: linda<br />year: 1885<br />n: 60","name: linda<br />year: 1886<br />n: 49","name: linda<br />year: 1887<br />n: 50","name: linda<br />year: 1888<br />n: 77","name: linda<br />year: 1889<br />n: 74","name: linda<br />year: 1890<br />n: 54","name: linda<br />year: 1891<br />n: 78","name: linda<br />year: 1892<br />n: 83","name: linda<br />year: 1893<br />n: 82","name: linda<br />year: 1894<br />n: 94","name: linda<br />year: 1895<br />n: 96","name: linda<br />year: 1896<br />n: 104","name: linda<br />year: 1897<br />n: 81","name: linda<br />year: 1898<br />n: 102","name: linda<br />year: 1899<br />n: 98","name: linda<br />year: 1900<br />n: 125","name: linda<br />year: 1901<br />n: 86","name: linda<br />year: 1902<br />n: 91","name: linda<br />year: 1903<br />n: 90","name: linda<br />year: 1904<br />n: 101","name: linda<br />year: 1905<br />n: 105","name: linda<br />year: 1906<br />n: 98","name: linda<br />year: 1907<br />n: 102","name: linda<br />year: 1908<br />n: 93","name: linda<br />year: 1909<br />n: 105","name: linda<br />year: 1910<br />n: 137","name: linda<br />year: 1911<br />n: 130","name: linda<br />year: 1912<br />n: 189","name: linda<br />year: 1913<br />n: 238","name: linda<br />year: 1914<br />n: 219","name: linda<br />year: 1915<br />n: 290","name: linda<br />year: 1916<br />n: 297","name: linda<br />year: 1917<br />n: 291","name: linda<br />year: 1918<br />n: 322","name: linda<br />year: 1919<br />n: 282","name: linda<br />year: 1920<br />n: 349","name: linda<br />year: 1921<br />n: 367","name: linda<br />year: 1922<br />n: 365","name: linda<br />year: 1923<br />n: 423","name: linda<br />year: 1924<br />n: 454","name: linda<br />year: 1925<br />n: 444","name: linda<br />year: 1926<br />n: 479","name: linda<br />year: 1927<br />n: 516","name: linda<br />year: 1928<br />n: 554","name: linda<br />year: 1929<br />n: 516","name: linda<br />year: 1930<br />n: 492","name: linda<br />year: 1931<br />n: 534","name: linda<br />year: 1932<br />n: 780","name: linda<br />year: 1933<br />n: 795","name: linda<br />year: 1934<br />n: 1000","name: linda<br />year: 1935<br />n: 1206","name: linda<br />year: 1936<br />n: 2448","name: linda<br />year: 1937<br />n: 4399","name: linda<br />year: 1938<br />n: 7074","name: linda<br />year: 1939<br />n: 10758","name: linda<br />year: 1940<br />n: 18427","name: linda<br />year: 1941<br />n: 23800","name: linda<br />year: 1942<br />n: 31732","name: linda<br />year: 1943<br />n: 38575","name: linda<br />year: 1944<br />n: 38525","name: linda<br />year: 1945<br />n: 41572","name: linda<br />year: 1946<br />n: 52826","name: linda<br />year: 1947<br />n: 99901","name: linda<br />year: 1948<br />n: 96417","name: linda<br />year: 1949<br />n: 91185","name: linda<br />year: 1950<br />n: 80562","name: linda<br />year: 1951<br />n: 74097","name: linda<br />year: 1952<br />n: 67225","name: linda<br />year: 1953<br />n: 61389","name: linda<br />year: 1954<br />n: 55497","name: linda<br />year: 1955<br />n: 51395","name: linda<br />year: 1956<br />n: 48172","name: linda<br />year: 1957<br />n: 44618","name: linda<br />year: 1958<br />n: 41994","name: linda<br />year: 1959<br />n: 40532","name: linda<br />year: 1960<br />n: 37410","name: linda<br />year: 1961<br />n: 35663","name: linda<br />year: 1962<br />n: 31551","name: linda<br />year: 1963<br />n: 27802","name: linda<br />year: 1964<br />n: 23728","name: linda<br />year: 1965<br />n: 19398","name: linda<br />year: 1966<br />n: 15614","name: linda<br />year: 1967<br />n: 13231","name: linda<br />year: 1968<br />n: 11409","name: linda<br />year: 1969<br />n: 10297","name: linda<br />year: 1970<br />n: 8769","name: linda<br />year: 1971<br />n: 7402","name: linda<br />year: 1972<br />n: 5776","name: linda<br />year: 1973<br />n: 4750","name: linda<br />year: 1974<br />n: 4102","name: linda<br />year: 1975<br />n: 3543","name: linda<br />year: 1976<br />n: 3152","name: linda<br />year: 1977<br />n: 2931","name: linda<br />year: 1978<br />n: 2950","name: linda<br />year: 1979<br />n: 2755","name: linda<br />year: 1980<br />n: 2823","name: linda<br />year: 1981<br />n: 2746","name: linda<br />year: 1982<br />n: 2806","name: linda<br />year: 1983<br />n: 2498","name: linda<br />year: 1984<br />n: 2346","name: linda<br />year: 1985<br />n: 2125","name: linda<br />year: 1986<br />n: 1973","name: linda<br />year: 1987<br />n: 1945","name: linda<br />year: 1988<br />n: 1853","name: linda<br />year: 1989<br />n: 1860","name: linda<br />year: 1990<br />n: 1670","name: linda<br />year: 1991<br />n: 1618","name: linda<br />year: 1992<br />n: 1592","name: linda<br />year: 1993<br />n: 1495","name: linda<br />year: 1994<br />n: 1294","name: linda<br />year: 1995<br />n: 1234","name: linda<br />year: 1996<br />n: 987","name: linda<br />year: 1997<br />n: 1098","name: linda<br />year: 1998<br />n: 971","name: linda<br />year: 1999<br />n: 900","name: linda<br />year: 2000<br />n: 850","name: linda<br />year: 2001<br />n: 837","name: linda<br />year: 2002<br />n: 769","name: linda<br />year: 2003<br />n: 741","name: linda<br />year: 2004<br />n: 727","name: linda<br />year: 2005<br />n: 749","name: linda<br />year: 2006<br />n: 700","name: linda<br />year: 2007<br />n: 660","name: linda<br />year: 2008<br />n: 613","name: linda<br />year: 2009<br />n: 551","name: linda<br />year: 2010<br />n: 477","name: linda<br />year: 2011<br />n: 489","name: linda<br />year: 2012<br />n: 448","name: linda<br />year: 2013<br />n: 443","name: linda<br />year: 2014<br />n: 470","name: linda<br />year: 2015<br />n: 425","name: linda<br />year: 2016<br />n: 436","name: linda<br />year: 2017<br />n: 404"],"type":"scatter","mode":"lines","line":{"width":7.55905511811024,"color":"rgba(0,191,125,1)","dash":"solid"},"hoveron":"points","name":"linda","legendgroup":"linda","showlegend":true,"xaxis":"x","yaxis":"y","hoverinfo":"text","frame":null},{"x":[1906,1911,1913,1914,1916,1917,1918,1919,1920,1921,1922,1923,1924,1925,1926,1927,1928,1929,1930,1931,1932,1933,1934,1935,1936,1937,1938,1939,1940,1941,1942,1943,1944,1945,1946,1947,1948,1949,1950,1951,1952,1953,1954,1955,1956,1957,1958,1959,1960,1961,1962,1963,1964,1965,1966,1967,1968,1969,1970,1971,1972,1973,1974,1975,1976,1977,1978,1979,1980,1981,1982,1983,1984,1985,1986,1987,1988,1989,1990,1991,1992,1993,1994,1995,1996,1997,1998,1999,2000,2001,2002,2003,2004,2005,2006,2007,2008,2009,2010,2011,2012,2013,2014,2015,2016,2017],"y":[10,6,7,9,7,8,12,6,12,17,8,10,7,14,14,9,14,6,14,15,14,11,13,11,13,14,8,21,18,13,26,34,23,35,65,102,82,102,99,105,126,146,133,178,191,277,310,405,386,390,400,645,523,1092,1592,1943,2185,2268,2355,6235,8948,10600,13314,15443,17664,21619,21914,23778,25406,27498,27293,28451,29263,30465,30212,29176,28353,28976,29699,27960,27383,27070,24412,23443,22189,20886,20671,21465,20712,18751,18177,20169,20191,18658,17115,16415,15253,13633,12432,11999,11402,10311,9686,9199,8917,8422],"text":["name: ryan<br />year: 1906<br />n: 10","name: ryan<br />year: 1911<br />n: 6","name: ryan<br />year: 1913<br />n: 7","name: ryan<br />year: 1914<br />n: 9","name: ryan<br />year: 1916<br />n: 7","name: ryan<br />year: 1917<br />n: 8","name: ryan<br />year: 1918<br />n: 12","name: ryan<br />year: 1919<br />n: 6","name: ryan<br />year: 1920<br />n: 12","name: ryan<br />year: 1921<br />n: 17","name: ryan<br />year: 1922<br />n: 8","name: ryan<br />year: 1923<br />n: 10","name: ryan<br />year: 1924<br />n: 7","name: ryan<br />year: 1925<br />n: 14","name: ryan<br />year: 1926<br />n: 14","name: ryan<br />year: 1927<br />n: 9","name: ryan<br />year: 1928<br />n: 14","name: ryan<br />year: 1929<br />n: 6","name: ryan<br />year: 1930<br />n: 14","name: ryan<br />year: 1931<br />n: 15","name: ryan<br />year: 1932<br />n: 14","name: ryan<br />year: 1933<br />n: 11","name: ryan<br />year: 1934<br />n: 13","name: ryan<br />year: 1935<br />n: 11","name: ryan<br />year: 1936<br />n: 13","name: ryan<br />year: 1937<br />n: 14","name: ryan<br />year: 1938<br />n: 8","name: ryan<br />year: 1939<br />n: 21","name: ryan<br />year: 1940<br />n: 18","name: ryan<br />year: 1941<br />n: 13","name: ryan<br />year: 1942<br />n: 26","name: ryan<br />year: 1943<br />n: 34","name: ryan<br />year: 1944<br />n: 23","name: ryan<br />year: 1945<br />n: 35","name: ryan<br />year: 1946<br />n: 65","name: ryan<br />year: 1947<br />n: 102","name: ryan<br />year: 1948<br />n: 82","name: ryan<br />year: 1949<br />n: 102","name: ryan<br />year: 1950<br />n: 99","name: ryan<br />year: 1951<br />n: 105","name: ryan<br />year: 1952<br />n: 126","name: ryan<br />year: 1953<br />n: 146","name: ryan<br />year: 1954<br />n: 133","name: ryan<br />year: 1955<br />n: 178","name: ryan<br />year: 1956<br />n: 191","name: ryan<br />year: 1957<br />n: 277","name: ryan<br />year: 1958<br />n: 310","name: ryan<br />year: 1959<br />n: 405","name: ryan<br />year: 1960<br />n: 386","name: ryan<br />year: 1961<br />n: 390","name: ryan<br />year: 1962<br />n: 400","name: ryan<br />year: 1963<br />n: 645","name: ryan<br />year: 1964<br />n: 523","name: ryan<br />year: 1965<br />n: 1092","name: ryan<br />year: 1966<br />n: 1592","name: ryan<br />year: 1967<br />n: 1943","name: ryan<br />year: 1968<br />n: 2185","name: ryan<br />year: 1969<br />n: 2268","name: ryan<br />year: 1970<br />n: 2355","name: ryan<br />year: 1971<br />n: 6235","name: ryan<br />year: 1972<br />n: 8948","name: ryan<br />year: 1973<br />n: 10600","name: ryan<br />year: 1974<br />n: 13314","name: ryan<br />year: 1975<br />n: 15443","name: ryan<br />year: 1976<br />n: 17664","name: ryan<br />year: 1977<br />n: 21619","name: ryan<br />year: 1978<br />n: 21914","name: ryan<br />year: 1979<br />n: 23778","name: ryan<br />year: 1980<br />n: 25406","name: ryan<br />year: 1981<br />n: 27498","name: ryan<br />year: 1982<br />n: 27293","name: ryan<br />year: 1983<br />n: 28451","name: ryan<br />year: 1984<br />n: 29263","name: ryan<br />year: 1985<br />n: 30465","name: ryan<br />year: 1986<br />n: 30212","name: ryan<br />year: 1987<br />n: 29176","name: ryan<br />year: 1988<br />n: 28353","name: ryan<br />year: 1989<br />n: 28976","name: ryan<br />year: 1990<br />n: 29699","name: ryan<br />year: 1991<br />n: 27960","name: ryan<br />year: 1992<br />n: 27383","name: ryan<br />year: 1993<br />n: 27070","name: ryan<br />year: 1994<br />n: 24412","name: ryan<br />year: 1995<br />n: 23443","name: ryan<br />year: 1996<br />n: 22189","name: ryan<br />year: 1997<br />n: 20886","name: ryan<br />year: 1998<br />n: 20671","name: ryan<br />year: 1999<br />n: 21465","name: ryan<br />year: 2000<br />n: 20712","name: ryan<br />year: 2001<br />n: 18751","name: ryan<br />year: 2002<br />n: 18177","name: ryan<br />year: 2003<br />n: 20169","name: ryan<br />year: 2004<br />n: 20191","name: ryan<br />year: 2005<br />n: 18658","name: ryan<br />year: 2006<br />n: 17115","name: ryan<br />year: 2007<br />n: 16415","name: ryan<br />year: 2008<br />n: 15253","name: ryan<br />year: 2009<br />n: 13633","name: ryan<br />year: 2010<br />n: 12432","name: ryan<br />year: 2011<br />n: 11999","name: ryan<br />year: 2012<br />n: 11402","name: ryan<br />year: 2013<br />n: 10311","name: ryan<br />year: 2014<br />n: 9686","name: ryan<br />year: 2015<br />n: 9199","name: ryan<br />year: 2016<br />n: 8917","name: ryan<br />year: 2017<br />n: 8422"],"type":"scatter","mode":"lines","line":{"width":7.55905511811024,"color":"rgba(0,176,246,1)","dash":"solid"},"hoveron":"points","name":"ryan","legendgroup":"ryan","showlegend":true,"xaxis":"x","yaxis":"y","hoverinfo":"text","frame":null},{"x":[1880,1881,1882,1883,1884,1885,1886,1887,1888,1889,1890,1891,1892,1893,1894,1895,1896,1897,1898,1899,1900,1901,1902,1903,1904,1905,1906,1907,1908,1909,1910,1911,1912,1913,1914,1915,1916,1917,1918,1919,1920,1921,1922,1923,1924,1925,1926,1927,1928,1929,1930,1931,1932,1933,1934,1935,1936,1937,1938,1939,1940,1941,1942,1943,1944,1945,1946,1947,1948,1949,1950,1951,1952,1953,1954,1955,1956,1957,1958,1959,1960,1961,1962,1963,1964,1965,1966,1967,1968,1969,1970,1971,1972,1973,1974,1975,1976,1977,1978,1979,1980,1981,1982,1983,1984,1985,1986,1987,1988,1989,1990,1991,1992,1993,1994,1995,1996,1997,1998,1999,2000,2001,2002,2003,2004,2005,2006,2007,2008,2009,2010,2011,2012,2013,2014,2015,2016,2017],"y":[9562,8554,9329,8427,8931,8077,8287,7514,8747,7818,7528,6813,7826,7255,7308,7317,7791,7230,7441,6109,8623,6022,6641,6346,6441,6523,6595,6933,7573,7949,8881,10643,19704,23632,29850,38693,40555,42588,45462,44147,50352,52051,51311,52360,53760,53592,52222,51802,49460,48146,47548,43507,42349,39240,40343,40358,39541,40873,42560,42231,44921,47926,55049,56067,52500,50353,60196,67140,62121,61631,60816,62888,63204,61931,61549,60072,59091,56995,54356,51521,49518,48207,45033,44659,44399,40289,38440,37807,37148,37832,39114,35633,30725,28184,27162,25734,24647,24957,24374,24892,25868,24975,25777,25577,25059,24787,24493,24368,24286,24764,24953,23921,23126,22250,21533,20204,20581,20043,20867,20734,20697,20123,20156,20021,20334,19078,18973,18907,18416,17929,17071,17367,16899,16647,16832,15904,15759,14922],"text":["name: william<br />year: 1880<br />n: 9562","name: william<br />year: 1881<br />n: 8554","name: william<br />year: 1882<br />n: 9329","name: william<br />year: 1883<br />n: 8427","name: william<br />year: 1884<br />n: 8931","name: william<br />year: 1885<br />n: 8077","name: william<br />year: 1886<br />n: 8287","name: william<br />year: 1887<br />n: 7514","name: william<br />year: 1888<br />n: 8747","name: william<br />year: 1889<br />n: 7818","name: william<br />year: 1890<br />n: 7528","name: william<br />year: 1891<br />n: 6813","name: william<br />year: 1892<br />n: 7826","name: william<br />year: 1893<br />n: 7255","name: william<br />year: 1894<br />n: 7308","name: william<br />year: 1895<br />n: 7317","name: william<br />year: 1896<br />n: 7791","name: william<br />year: 1897<br />n: 7230","name: william<br />year: 1898<br />n: 7441","name: william<br />year: 1899<br />n: 6109","name: william<br />year: 1900<br />n: 8623","name: william<br />year: 1901<br />n: 6022","name: william<br />year: 1902<br />n: 6641","name: william<br />year: 1903<br />n: 6346","name: william<br />year: 1904<br />n: 6441","name: william<br />year: 1905<br />n: 6523","name: william<br />year: 1906<br />n: 6595","name: william<br />year: 1907<br />n: 6933","name: william<br />year: 1908<br />n: 7573","name: william<br />year: 1909<br />n: 7949","name: william<br />year: 1910<br />n: 8881","name: william<br />year: 1911<br />n: 10643","name: william<br />year: 1912<br />n: 19704","name: william<br />year: 1913<br />n: 23632","name: william<br />year: 1914<br />n: 29850","name: william<br />year: 1915<br />n: 38693","name: william<br />year: 1916<br />n: 40555","name: william<br />year: 1917<br />n: 42588","name: william<br />year: 1918<br />n: 45462","name: william<br />year: 1919<br />n: 44147","name: william<br />year: 1920<br />n: 50352","name: william<br />year: 1921<br />n: 52051","name: william<br />year: 1922<br />n: 51311","name: william<br />year: 1923<br />n: 52360","name: william<br />year: 1924<br />n: 53760","name: william<br />year: 1925<br />n: 53592","name: william<br />year: 1926<br />n: 52222","name: william<br />year: 1927<br />n: 51802","name: william<br />year: 1928<br />n: 49460","name: william<br />year: 1929<br />n: 48146","name: william<br />year: 1930<br />n: 47548","name: william<br />year: 1931<br />n: 43507","name: william<br />year: 1932<br />n: 42349","name: william<br />year: 1933<br />n: 39240","name: william<br />year: 1934<br />n: 40343","name: william<br />year: 1935<br />n: 40358","name: william<br />year: 1936<br />n: 39541","name: william<br />year: 1937<br />n: 40873","name: william<br />year: 1938<br />n: 42560","name: william<br />year: 1939<br />n: 42231","name: william<br />year: 1940<br />n: 44921","name: william<br />year: 1941<br />n: 47926","name: william<br />year: 1942<br />n: 55049","name: william<br />year: 1943<br />n: 56067","name: william<br />year: 1944<br />n: 52500","name: william<br />year: 1945<br />n: 50353","name: william<br />year: 1946<br />n: 60196","name: william<br />year: 1947<br />n: 67140","name: william<br />year: 1948<br />n: 62121","name: william<br />year: 1949<br />n: 61631","name: william<br />year: 1950<br />n: 60816","name: william<br />year: 1951<br />n: 62888","name: william<br />year: 1952<br />n: 63204","name: william<br />year: 1953<br />n: 61931","name: william<br />year: 1954<br />n: 61549","name: william<br />year: 1955<br />n: 60072","name: william<br />year: 1956<br />n: 59091","name: william<br />year: 1957<br />n: 56995","name: william<br />year: 1958<br />n: 54356","name: william<br />year: 1959<br />n: 51521","name: william<br />year: 1960<br />n: 49518","name: william<br />year: 1961<br />n: 48207","name: william<br />year: 1962<br />n: 45033","name: william<br />year: 1963<br />n: 44659","name: william<br />year: 1964<br />n: 44399","name: william<br />year: 1965<br />n: 40289","name: william<br />year: 1966<br />n: 38440","name: william<br />year: 1967<br />n: 37807","name: william<br />year: 1968<br />n: 37148","name: william<br />year: 1969<br />n: 37832","name: william<br />year: 1970<br />n: 39114","name: william<br />year: 1971<br />n: 35633","name: william<br />year: 1972<br />n: 30725","name: william<br />year: 1973<br />n: 28184","name: william<br />year: 1974<br />n: 27162","name: william<br />year: 1975<br />n: 25734","name: william<br />year: 1976<br />n: 24647","name: william<br />year: 1977<br />n: 24957","name: william<br />year: 1978<br />n: 24374","name: william<br />year: 1979<br />n: 24892","name: william<br />year: 1980<br />n: 25868","name: william<br />year: 1981<br />n: 24975","name: william<br />year: 1982<br />n: 25777","name: william<br />year: 1983<br />n: 25577","name: william<br />year: 1984<br />n: 25059","name: william<br />year: 1985<br />n: 24787","name: william<br />year: 1986<br />n: 24493","name: william<br />year: 1987<br />n: 24368","name: william<br />year: 1988<br />n: 24286","name: william<br />year: 1989<br />n: 24764","name: william<br />year: 1990<br />n: 24953","name: william<br />year: 1991<br />n: 23921","name: william<br />year: 1992<br />n: 23126","name: william<br />year: 1993<br />n: 22250","name: william<br />year: 1994<br />n: 21533","name: william<br />year: 1995<br />n: 20204","name: william<br />year: 1996<br />n: 20581","name: william<br />year: 1997<br />n: 20043","name: william<br />year: 1998<br />n: 20867","name: william<br />year: 1999<br />n: 20734","name: william<br />year: 2000<br />n: 20697","name: william<br />year: 2001<br />n: 20123","name: william<br />year: 2002<br />n: 20156","name: william<br />year: 2003<br />n: 20021","name: william<br />year: 2004<br />n: 20334","name: william<br />year: 2005<br />n: 19078","name: william<br />year: 2006<br />n: 18973","name: william<br />year: 2007<br />n: 18907","name: william<br />year: 2008<br />n: 18416","name: william<br />year: 2009<br />n: 17929","name: william<br />year: 2010<br />n: 17071","name: william<br />year: 2011<br />n: 17367","name: william<br />year: 2012<br />n: 16899","name: william<br />year: 2013<br />n: 16647","name: william<br />year: 2014<br />n: 16832","name: william<br />year: 2015<br />n: 15904","name: william<br />year: 2016<br />n: 15759","name: william<br />year: 2017<br />n: 14922"],"type":"scatter","mode":"lines","line":{"width":7.55905511811024,"color":"rgba(231,107,243,1)","dash":"solid"},"hoveron":"points","name":"william","legendgroup":"william","showlegend":true,"xaxis":"x","yaxis":"y","hoverinfo":"text","frame":null}],"layout":{"margin":{"t":27.689497716895,"r":7.30593607305936,"b":63.1631382316314,"l":101.286841012868},"plot_bgcolor":"rgba(235,235,235,1)","paper_bgcolor":"rgba(255,255,255,1)","font":{"color":"rgba(0,0,0,1)","family":"","size":26.5670402656704},"xaxis":{"domain":[0,1],"automargin":true,"type":"linear","autorange":false,"range":[1873.15,2023.85],"tickmode":"array","ticktext":["1880","1920","1960","2000"],"tickvals":[1880,1920,1960,2000],"categoryorder":"array","categoryarray":["1880","1920","1960","2000"],"nticks":null,"ticks":"outside","tickcolor":"rgba(51,51,51,1)","ticklen":3.65296803652968,"tickwidth":0.66417600664176,"showticklabels":true,"tickfont":{"color":"rgba(77,77,77,1)","family":"","size":21.2536322125363},"tickangle":-0,"showline":false,"linecolor":null,"linewidth":0,"showgrid":true,"gridcolor":"rgba(255,255,255,1)","gridwidth":0.66417600664176,"zeroline":false,"anchor":"y","title":{"text":"year","font":{"color":"rgba(0,0,0,1)","family":"","size":26.5670402656704}},"hoverformat":".2f"},"yaxis":{"domain":[0,1],"automargin":true,"type":"linear","autorange":false,"range":[-4988.75,104895.75],"tickmode":"array","ticktext":["0","25000","50000","75000","100000"],"tickvals":[0,25000,50000,75000,100000],"categoryorder":"array","categoryarray":["0","25000","50000","75000","100000"],"nticks":null,"ticks":"outside","tickcolor":"rgba(51,51,51,1)","ticklen":3.65296803652968,"tickwidth":0.66417600664176,"showticklabels":true,"tickfont":{"color":"rgba(77,77,77,1)","family":"","size":21.2536322125363},"tickangle":-0,"showline":false,"linecolor":null,"linewidth":0,"showgrid":true,"gridcolor":"rgba(255,255,255,1)","gridwidth":0.66417600664176,"zeroline":false,"anchor":"x","title":{"text":"n","font":{"color":"rgba(0,0,0,1)","family":"","size":26.5670402656704}},"hoverformat":".2f"},"shapes":[{"type":"rect","fillcolor":null,"line":{"color":null,"width":0,"linetype":[]},"yref":"paper","xref":"paper","x0":0,"x1":1,"y0":0,"y1":1}],"showlegend":true,"legend":{"bgcolor":"rgba(255,255,255,1)","bordercolor":"transparent","borderwidth":1.88976377952756,"font":{"color":"rgba(0,0,0,1)","family":"","size":21.2536322125363},"y":0.94750656167979},"annotations":[{"text":"name","x":1.02,"y":1,"showarrow":false,"ax":0,"ay":0,"font":{"color":"rgba(0,0,0,1)","family":"","size":26.5670402656704},"xref":"paper","yref":"paper","textangle":-0,"xanchor":"left","yanchor":"bottom","legendTitle":true}],"hovermode":"closest","barmode":"relative"},"config":{"doubleClick":"reset","showSendToCloud":false},"source":"A","attrs":{"73c42f12e9e4":{"colour":{},"x":{},"y":{},"type":"scatter"}},"cur_data":"73c42f12e9e4","visdat":{"73c42f12e9e4":["function (y) ","x"]},"highlight":{"on":"plotly_click","persistent":false,"dynamic":false,"selectize":false,"opacityDim":0.2,"selected":{"opacity":1},"debounce":0},"shinyEvents":["plotly_hover","plotly_click","plotly_selected","plotly_relayout","plotly_brushed","plotly_brushing","plotly_clickannotation","plotly_doubleclick","plotly_deselect","plotly_afterplot","plotly_sunburstclick"],"base_url":"https://plot.ly"},"evals":[],"jsHooks":[]}</script> --- ## `ggplotly()` * Translates a `ggplot` to a `plotly` + Conversion isn't always perfect. * Can also create graphs with `plot_ly()` + Another great final project idea: Learn `plot_ly()` --- ```r p_improved <- ggplotly(p, dynamicTicks = TRUE) %>% rangeslider() %>% layout(hovermode = "x") p_improved ``` <div id="htmlwidget-03cc8ec3c71a3e24d7ed" style="width:648px;height:504px;" class="plotly html-widget"></div> <script type="application/json" data-for="htmlwidget-03cc8ec3c71a3e24d7ed">{"x":{"data":[{"x":[1880,1881,1882,1883,1884,1885,1886,1887,1888,1889,1890,1891,1892,1893,1894,1895,1896,1897,1898,1899,1900,1901,1902,1903,1904,1905,1906,1907,1908,1909,1910,1911,1912,1913,1914,1915,1916,1917,1918,1919,1920,1921,1922,1923,1924,1925,1926,1927,1928,1929,1930,1931,1932,1933,1934,1935,1936,1937,1938,1939,1940,1941,1942,1943,1944,1945,1946,1947,1948,1949,1950,1951,1952,1953,1954,1955,1956,1957,1958,1959,1960,1961,1962,1963,1964,1965,1966,1967,1968,1969,1970,1971,1972,1973,1974,1975,1976,1977,1978,1979,1980,1981,1982,1983,1984,1985,1986,1987,1988,1989,1990,1991,1992,1993,1994,1995,1996,1997,1998,1999,2000,2001,2002,2003,2004,2005,2006,2007,2008,2009,2010,2011,2012,2013,2014,2015,2016,2017],"y":[7,7,8,6,14,6,11,8,18,9,18,14,14,15,10,19,9,9,13,14,23,8,9,16,16,17,18,17,17,18,28,21,36,25,42,55,53,55,56,40,43,48,40,52,41,34,35,39,36,42,38,39,44,43,46,47,43,72,50,77,61,81,127,121,124,132,240,430,482,406,402,466,452,495,424,386,406,476,529,522,559,668,865,1126,1178,1537,1677,1773,1840,2505,4038,5379,6234,7246,10696,12979,18424,24934,26198,27890,34049,42699,45634,45476,46035,48575,52891,56234,51763,48137,46615,43518,38455,35088,32222,27986,24241,21088,18265,16376,15736,13947,11935,10465,9506,8130,6820,5721,4741,3806,3202,2629,2332,1947,1796,1585,1384,1271],"text":["name: jessica<br />year: 1880<br />n: 7","name: jessica<br />year: 1881<br />n: 7","name: jessica<br />year: 1882<br />n: 8","name: jessica<br />year: 1883<br />n: 6","name: jessica<br />year: 1884<br />n: 14","name: jessica<br />year: 1885<br />n: 6","name: jessica<br />year: 1886<br />n: 11","name: jessica<br />year: 1887<br />n: 8","name: jessica<br />year: 1888<br />n: 18","name: jessica<br />year: 1889<br />n: 9","name: jessica<br />year: 1890<br />n: 18","name: jessica<br />year: 1891<br />n: 14","name: jessica<br />year: 1892<br />n: 14","name: jessica<br />year: 1893<br />n: 15","name: jessica<br />year: 1894<br />n: 10","name: jessica<br />year: 1895<br />n: 19","name: jessica<br />year: 1896<br />n: 9","name: jessica<br />year: 1897<br />n: 9","name: jessica<br />year: 1898<br />n: 13","name: jessica<br />year: 1899<br />n: 14","name: jessica<br />year: 1900<br />n: 23","name: jessica<br />year: 1901<br />n: 8","name: jessica<br />year: 1902<br />n: 9","name: jessica<br />year: 1903<br />n: 16","name: jessica<br />year: 1904<br />n: 16","name: jessica<br />year: 1905<br />n: 17","name: jessica<br />year: 1906<br />n: 18","name: jessica<br />year: 1907<br />n: 17","name: jessica<br />year: 1908<br />n: 17","name: jessica<br />year: 1909<br />n: 18","name: jessica<br />year: 1910<br />n: 28","name: jessica<br />year: 1911<br />n: 21","name: jessica<br />year: 1912<br />n: 36","name: jessica<br />year: 1913<br />n: 25","name: jessica<br />year: 1914<br />n: 42","name: jessica<br />year: 1915<br />n: 55","name: jessica<br />year: 1916<br />n: 53","name: jessica<br />year: 1917<br />n: 55","name: jessica<br />year: 1918<br />n: 56","name: jessica<br />year: 1919<br />n: 40","name: jessica<br />year: 1920<br />n: 43","name: jessica<br />year: 1921<br />n: 48","name: jessica<br />year: 1922<br />n: 40","name: jessica<br />year: 1923<br />n: 52","name: jessica<br />year: 1924<br />n: 41","name: jessica<br />year: 1925<br />n: 34","name: jessica<br />year: 1926<br />n: 35","name: jessica<br />year: 1927<br />n: 39","name: jessica<br />year: 1928<br />n: 36","name: jessica<br />year: 1929<br />n: 42","name: jessica<br />year: 1930<br />n: 38","name: jessica<br />year: 1931<br />n: 39","name: jessica<br />year: 1932<br />n: 44","name: jessica<br />year: 1933<br />n: 43","name: jessica<br />year: 1934<br />n: 46","name: jessica<br />year: 1935<br />n: 47","name: jessica<br />year: 1936<br />n: 43","name: jessica<br />year: 1937<br />n: 72","name: jessica<br />year: 1938<br />n: 50","name: jessica<br />year: 1939<br />n: 77","name: jessica<br />year: 1940<br />n: 61","name: jessica<br />year: 1941<br />n: 81","name: jessica<br />year: 1942<br />n: 127","name: jessica<br />year: 1943<br />n: 121","name: jessica<br />year: 1944<br />n: 124","name: jessica<br />year: 1945<br />n: 132","name: jessica<br />year: 1946<br />n: 240","name: jessica<br />year: 1947<br />n: 430","name: jessica<br />year: 1948<br />n: 482","name: jessica<br />year: 1949<br />n: 406","name: jessica<br />year: 1950<br />n: 402","name: jessica<br />year: 1951<br />n: 466","name: jessica<br />year: 1952<br />n: 452","name: jessica<br />year: 1953<br />n: 495","name: jessica<br />year: 1954<br />n: 424","name: jessica<br />year: 1955<br />n: 386","name: jessica<br />year: 1956<br />n: 406","name: jessica<br />year: 1957<br />n: 476","name: jessica<br />year: 1958<br />n: 529","name: jessica<br />year: 1959<br />n: 522","name: jessica<br />year: 1960<br />n: 559","name: jessica<br />year: 1961<br />n: 668","name: jessica<br />year: 1962<br />n: 865","name: jessica<br />year: 1963<br />n: 1126","name: jessica<br />year: 1964<br />n: 1178","name: jessica<br />year: 1965<br />n: 1537","name: jessica<br />year: 1966<br />n: 1677","name: jessica<br />year: 1967<br />n: 1773","name: jessica<br />year: 1968<br />n: 1840","name: jessica<br />year: 1969<br />n: 2505","name: jessica<br />year: 1970<br />n: 4038","name: jessica<br />year: 1971<br />n: 5379","name: jessica<br />year: 1972<br />n: 6234","name: jessica<br />year: 1973<br />n: 7246","name: jessica<br />year: 1974<br />n: 10696","name: jessica<br />year: 1975<br />n: 12979","name: jessica<br />year: 1976<br />n: 18424","name: jessica<br />year: 1977<br />n: 24934","name: jessica<br />year: 1978<br />n: 26198","name: jessica<br />year: 1979<br />n: 27890","name: jessica<br />year: 1980<br />n: 34049","name: jessica<br />year: 1981<br />n: 42699","name: jessica<br />year: 1982<br />n: 45634","name: jessica<br />year: 1983<br />n: 45476","name: jessica<br />year: 1984<br />n: 46035","name: jessica<br />year: 1985<br />n: 48575","name: jessica<br />year: 1986<br />n: 52891","name: jessica<br />year: 1987<br />n: 56234","name: jessica<br />year: 1988<br />n: 51763","name: jessica<br />year: 1989<br />n: 48137","name: jessica<br />year: 1990<br />n: 46615","name: jessica<br />year: 1991<br />n: 43518","name: jessica<br />year: 1992<br />n: 38455","name: jessica<br />year: 1993<br />n: 35088","name: jessica<br />year: 1994<br />n: 32222","name: jessica<br />year: 1995<br />n: 27986","name: jessica<br />year: 1996<br />n: 24241","name: jessica<br />year: 1997<br />n: 21088","name: jessica<br />year: 1998<br />n: 18265","name: jessica<br />year: 1999<br />n: 16376","name: jessica<br />year: 2000<br />n: 15736","name: jessica<br />year: 2001<br />n: 13947","name: jessica<br />year: 2002<br />n: 11935","name: jessica<br />year: 2003<br />n: 10465","name: jessica<br />year: 2004<br />n: 9506","name: jessica<br />year: 2005<br />n: 8130","name: jessica<br />year: 2006<br />n: 6820","name: jessica<br />year: 2007<br />n: 5721","name: jessica<br />year: 2008<br />n: 4741","name: jessica<br />year: 2009<br />n: 3806","name: jessica<br />year: 2010<br />n: 3202","name: jessica<br />year: 2011<br />n: 2629","name: jessica<br />year: 2012<br />n: 2332","name: jessica<br />year: 2013<br />n: 1947","name: jessica<br />year: 2014<br />n: 1796","name: jessica<br />year: 2015<br />n: 1585","name: jessica<br />year: 2016<br />n: 1384","name: jessica<br />year: 2017<br />n: 1271"],"type":"scatter","mode":"lines","line":{"width":7.55905511811024,"color":"rgba(248,118,109,1)","dash":"solid"},"hoveron":"points","name":"jessica","legendgroup":"jessica","showlegend":true,"xaxis":"x","yaxis":"y","hoverinfo":"text","frame":null},{"x":[1880,1881,1882,1883,1884,1885,1886,1887,1888,1889,1890,1891,1892,1893,1894,1895,1896,1897,1898,1899,1900,1901,1902,1903,1904,1905,1906,1907,1908,1909,1910,1911,1912,1913,1914,1915,1916,1917,1918,1919,1920,1921,1922,1923,1924,1925,1926,1927,1928,1929,1930,1931,1932,1933,1934,1935,1936,1937,1938,1939,1940,1941,1942,1943,1944,1945,1946,1947,1948,1949,1950,1951,1952,1953,1954,1955,1956,1957,1958,1959,1960,1961,1962,1963,1964,1965,1966,1967,1968,1969,1970,1971,1972,1973,1974,1975,1976,1977,1978,1979,1980,1981,1982,1983,1984,1985,1986,1987,1988,1989,1990,1991,1992,1993,1994,1995,1996,1997,1998,1999,2000,2001,2002,2003,2004,2005,2006,2007,2008,2009,2010,2011,2012,2013,2014,2015,2016,2017],"y":[57,40,50,55,41,43,55,41,50,33,24,24,41,23,24,29,30,29,39,24,36,22,17,21,19,18,27,26,29,28,44,43,60,78,87,136,99,122,118,139,128,125,124,129,114,109,105,117,118,74,90,95,111,102,106,80,100,92,72,101,90,93,112,95,104,97,113,141,130,183,162,164,178,167,191,244,241,272,276,327,314,354,335,373,392,463,487,563,735,1330,2185,3668,5061,8101,11662,14667,16962,22190,25358,31345,36282,39293,38268,36937,40523,42471,37845,40268,42947,44297,43382,41359,36338,33692,31449,30779,29244,28344,28139,27320,27592,26061,26032,25136,24319,23291,22348,20688,19225,17668,15451,13788,12670,11835,10899,9800,9200,8251],"text":["name: joshua<br />year: 1880<br />n: 57","name: joshua<br />year: 1881<br />n: 40","name: joshua<br />year: 1882<br />n: 50","name: joshua<br />year: 1883<br />n: 55","name: joshua<br />year: 1884<br />n: 41","name: joshua<br />year: 1885<br />n: 43","name: joshua<br />year: 1886<br />n: 55","name: joshua<br />year: 1887<br />n: 41","name: joshua<br />year: 1888<br />n: 50","name: joshua<br />year: 1889<br />n: 33","name: joshua<br />year: 1890<br />n: 24","name: joshua<br />year: 1891<br />n: 24","name: joshua<br />year: 1892<br />n: 41","name: joshua<br />year: 1893<br />n: 23","name: joshua<br />year: 1894<br />n: 24","name: joshua<br />year: 1895<br />n: 29","name: joshua<br />year: 1896<br />n: 30","name: joshua<br />year: 1897<br />n: 29","name: joshua<br />year: 1898<br />n: 39","name: joshua<br />year: 1899<br />n: 24","name: joshua<br />year: 1900<br />n: 36","name: joshua<br />year: 1901<br />n: 22","name: joshua<br />year: 1902<br />n: 17","name: joshua<br />year: 1903<br />n: 21","name: joshua<br />year: 1904<br />n: 19","name: joshua<br />year: 1905<br />n: 18","name: joshua<br />year: 1906<br />n: 27","name: joshua<br />year: 1907<br />n: 26","name: joshua<br />year: 1908<br />n: 29","name: joshua<br />year: 1909<br />n: 28","name: joshua<br />year: 1910<br />n: 44","name: joshua<br />year: 1911<br />n: 43","name: joshua<br />year: 1912<br />n: 60","name: joshua<br />year: 1913<br />n: 78","name: joshua<br />year: 1914<br />n: 87","name: joshua<br />year: 1915<br />n: 136","name: joshua<br />year: 1916<br />n: 99","name: joshua<br />year: 1917<br />n: 122","name: joshua<br />year: 1918<br />n: 118","name: joshua<br />year: 1919<br />n: 139","name: joshua<br />year: 1920<br />n: 128","name: joshua<br />year: 1921<br />n: 125","name: joshua<br />year: 1922<br />n: 124","name: joshua<br />year: 1923<br />n: 129","name: joshua<br />year: 1924<br />n: 114","name: joshua<br />year: 1925<br />n: 109","name: joshua<br />year: 1926<br />n: 105","name: joshua<br />year: 1927<br />n: 117","name: joshua<br />year: 1928<br />n: 118","name: joshua<br />year: 1929<br />n: 74","name: joshua<br />year: 1930<br />n: 90","name: joshua<br />year: 1931<br />n: 95","name: joshua<br />year: 1932<br />n: 111","name: joshua<br />year: 1933<br />n: 102","name: joshua<br />year: 1934<br />n: 106","name: joshua<br />year: 1935<br />n: 80","name: joshua<br />year: 1936<br />n: 100","name: joshua<br />year: 1937<br />n: 92","name: joshua<br />year: 1938<br />n: 72","name: joshua<br />year: 1939<br />n: 101","name: joshua<br />year: 1940<br />n: 90","name: joshua<br />year: 1941<br />n: 93","name: joshua<br />year: 1942<br />n: 112","name: joshua<br />year: 1943<br />n: 95","name: joshua<br />year: 1944<br />n: 104","name: joshua<br />year: 1945<br />n: 97","name: joshua<br />year: 1946<br />n: 113","name: joshua<br />year: 1947<br />n: 141","name: joshua<br />year: 1948<br />n: 130","name: joshua<br />year: 1949<br />n: 183","name: joshua<br />year: 1950<br />n: 162","name: joshua<br />year: 1951<br />n: 164","name: joshua<br />year: 1952<br />n: 178","name: joshua<br />year: 1953<br />n: 167","name: joshua<br />year: 1954<br />n: 191","name: joshua<br />year: 1955<br />n: 244","name: joshua<br />year: 1956<br />n: 241","name: joshua<br />year: 1957<br />n: 272","name: joshua<br />year: 1958<br />n: 276","name: joshua<br />year: 1959<br />n: 327","name: joshua<br />year: 1960<br />n: 314","name: joshua<br />year: 1961<br />n: 354","name: joshua<br />year: 1962<br />n: 335","name: joshua<br />year: 1963<br />n: 373","name: joshua<br />year: 1964<br />n: 392","name: joshua<br />year: 1965<br />n: 463","name: joshua<br />year: 1966<br />n: 487","name: joshua<br />year: 1967<br />n: 563","name: joshua<br />year: 1968<br />n: 735","name: joshua<br />year: 1969<br />n: 1330","name: joshua<br />year: 1970<br />n: 2185","name: joshua<br />year: 1971<br />n: 3668","name: joshua<br />year: 1972<br />n: 5061","name: joshua<br />year: 1973<br />n: 8101","name: joshua<br />year: 1974<br />n: 11662","name: joshua<br />year: 1975<br />n: 14667","name: joshua<br />year: 1976<br />n: 16962","name: joshua<br />year: 1977<br />n: 22190","name: joshua<br />year: 1978<br />n: 25358","name: joshua<br />year: 1979<br />n: 31345","name: joshua<br />year: 1980<br />n: 36282","name: joshua<br />year: 1981<br />n: 39293","name: joshua<br />year: 1982<br />n: 38268","name: joshua<br />year: 1983<br />n: 36937","name: joshua<br />year: 1984<br />n: 40523","name: joshua<br />year: 1985<br />n: 42471","name: joshua<br />year: 1986<br />n: 37845","name: joshua<br />year: 1987<br />n: 40268","name: joshua<br />year: 1988<br />n: 42947","name: joshua<br />year: 1989<br />n: 44297","name: joshua<br />year: 1990<br />n: 43382","name: joshua<br />year: 1991<br />n: 41359","name: joshua<br />year: 1992<br />n: 36338","name: joshua<br />year: 1993<br />n: 33692","name: joshua<br />year: 1994<br />n: 31449","name: joshua<br />year: 1995<br />n: 30779","name: joshua<br />year: 1996<br />n: 29244","name: joshua<br />year: 1997<br />n: 28344","name: joshua<br />year: 1998<br />n: 28139","name: joshua<br />year: 1999<br />n: 27320","name: joshua<br />year: 2000<br />n: 27592","name: joshua<br />year: 2001<br />n: 26061","name: joshua<br />year: 2002<br />n: 26032","name: joshua<br />year: 2003<br />n: 25136","name: joshua<br />year: 2004<br />n: 24319","name: joshua<br />year: 2005<br />n: 23291","name: joshua<br />year: 2006<br />n: 22348","name: joshua<br />year: 2007<br />n: 20688","name: joshua<br />year: 2008<br />n: 19225","name: joshua<br />year: 2009<br />n: 17668","name: joshua<br />year: 2010<br />n: 15451","name: joshua<br />year: 2011<br />n: 13788","name: joshua<br />year: 2012<br />n: 12670","name: joshua<br />year: 2013<br />n: 11835","name: joshua<br />year: 2014<br />n: 10899","name: joshua<br />year: 2015<br />n: 9800","name: joshua<br />year: 2016<br />n: 9200","name: joshua<br />year: 2017<br />n: 8251"],"type":"scatter","mode":"lines","line":{"width":7.55905511811024,"color":"rgba(163,165,0,1)","dash":"solid"},"hoveron":"points","name":"joshua","legendgroup":"joshua","showlegend":true,"xaxis":"x","yaxis":"y","hoverinfo":"text","frame":null},{"x":[1880,1881,1882,1883,1884,1885,1886,1887,1888,1889,1890,1891,1892,1893,1894,1895,1896,1897,1898,1899,1900,1901,1902,1903,1904,1905,1906,1907,1908,1909,1910,1911,1912,1913,1914,1915,1916,1917,1918,1919,1920,1921,1922,1923,1924,1925,1926,1927,1928,1929,1930,1931,1932,1933,1934,1935,1936,1937,1938,1939,1940,1941,1942,1943,1944,1945,1946,1947,1948,1949,1950,1951,1952,1953,1954,1955,1956,1957,1958,1959,1960,1961,1962,1963,1964,1965,1966,1967,1968,1969,1970,1971,1972,1973,1974,1975,1976,1977,1978,1979,1980,1981,1982,1983,1984,1985,1986,1987,1988,1989,1990,1991,1992,1993,1994,1995,1996,1997,1998,1999,2000,2001,2002,2003,2004,2005,2006,2007,2008,2009,2010,2011,2012,2013,2014,2015,2016,2017],"y":[27,38,36,49,33,60,49,50,77,74,54,78,83,82,94,96,104,81,102,98,125,86,91,90,101,105,98,102,93,105,137,130,189,238,219,290,297,291,322,282,349,367,365,423,454,444,479,516,554,516,492,534,780,795,1000,1206,2448,4399,7074,10758,18427,23800,31732,38575,38525,41572,52826,99901,96417,91185,80562,74097,67225,61389,55497,51395,48172,44618,41994,40532,37410,35663,31551,27802,23728,19398,15614,13231,11409,10297,8769,7402,5776,4750,4102,3543,3152,2931,2950,2755,2823,2746,2806,2498,2346,2125,1973,1945,1853,1860,1670,1618,1592,1495,1294,1234,987,1098,971,900,850,837,769,741,727,749,700,660,613,551,477,489,448,443,470,425,436,404],"text":["name: linda<br />year: 1880<br />n: 27","name: linda<br />year: 1881<br />n: 38","name: linda<br />year: 1882<br />n: 36","name: linda<br />year: 1883<br />n: 49","name: linda<br />year: 1884<br />n: 33","name: linda<br />year: 1885<br />n: 60","name: linda<br />year: 1886<br />n: 49","name: linda<br />year: 1887<br />n: 50","name: linda<br />year: 1888<br />n: 77","name: linda<br />year: 1889<br />n: 74","name: linda<br />year: 1890<br />n: 54","name: linda<br />year: 1891<br />n: 78","name: linda<br />year: 1892<br />n: 83","name: linda<br />year: 1893<br />n: 82","name: linda<br />year: 1894<br />n: 94","name: linda<br />year: 1895<br />n: 96","name: linda<br />year: 1896<br />n: 104","name: linda<br />year: 1897<br />n: 81","name: linda<br />year: 1898<br />n: 102","name: linda<br />year: 1899<br />n: 98","name: linda<br />year: 1900<br />n: 125","name: linda<br />year: 1901<br />n: 86","name: linda<br />year: 1902<br />n: 91","name: linda<br />year: 1903<br />n: 90","name: linda<br />year: 1904<br />n: 101","name: linda<br />year: 1905<br />n: 105","name: linda<br />year: 1906<br />n: 98","name: linda<br />year: 1907<br />n: 102","name: linda<br />year: 1908<br />n: 93","name: linda<br />year: 1909<br />n: 105","name: linda<br />year: 1910<br />n: 137","name: linda<br />year: 1911<br />n: 130","name: linda<br />year: 1912<br />n: 189","name: linda<br />year: 1913<br />n: 238","name: linda<br />year: 1914<br />n: 219","name: linda<br />year: 1915<br />n: 290","name: linda<br />year: 1916<br />n: 297","name: linda<br />year: 1917<br />n: 291","name: linda<br />year: 1918<br />n: 322","name: linda<br />year: 1919<br />n: 282","name: linda<br />year: 1920<br />n: 349","name: linda<br />year: 1921<br />n: 367","name: linda<br />year: 1922<br />n: 365","name: linda<br />year: 1923<br />n: 423","name: linda<br />year: 1924<br />n: 454","name: linda<br />year: 1925<br />n: 444","name: linda<br />year: 1926<br />n: 479","name: linda<br />year: 1927<br />n: 516","name: linda<br />year: 1928<br />n: 554","name: linda<br />year: 1929<br />n: 516","name: linda<br />year: 1930<br />n: 492","name: linda<br />year: 1931<br />n: 534","name: linda<br />year: 1932<br />n: 780","name: linda<br />year: 1933<br />n: 795","name: linda<br />year: 1934<br />n: 1000","name: linda<br />year: 1935<br />n: 1206","name: linda<br />year: 1936<br />n: 2448","name: linda<br />year: 1937<br />n: 4399","name: linda<br />year: 1938<br />n: 7074","name: linda<br />year: 1939<br />n: 10758","name: linda<br />year: 1940<br />n: 18427","name: linda<br />year: 1941<br />n: 23800","name: linda<br />year: 1942<br />n: 31732","name: linda<br />year: 1943<br />n: 38575","name: linda<br />year: 1944<br />n: 38525","name: linda<br />year: 1945<br />n: 41572","name: linda<br />year: 1946<br />n: 52826","name: linda<br />year: 1947<br />n: 99901","name: linda<br />year: 1948<br />n: 96417","name: linda<br />year: 1949<br />n: 91185","name: linda<br />year: 1950<br />n: 80562","name: linda<br />year: 1951<br />n: 74097","name: linda<br />year: 1952<br />n: 67225","name: linda<br />year: 1953<br />n: 61389","name: linda<br />year: 1954<br />n: 55497","name: linda<br />year: 1955<br />n: 51395","name: linda<br />year: 1956<br />n: 48172","name: linda<br />year: 1957<br />n: 44618","name: linda<br />year: 1958<br />n: 41994","name: linda<br />year: 1959<br />n: 40532","name: linda<br />year: 1960<br />n: 37410","name: linda<br />year: 1961<br />n: 35663","name: linda<br />year: 1962<br />n: 31551","name: linda<br />year: 1963<br />n: 27802","name: linda<br />year: 1964<br />n: 23728","name: linda<br />year: 1965<br />n: 19398","name: linda<br />year: 1966<br />n: 15614","name: linda<br />year: 1967<br />n: 13231","name: linda<br />year: 1968<br />n: 11409","name: linda<br />year: 1969<br />n: 10297","name: linda<br />year: 1970<br />n: 8769","name: linda<br />year: 1971<br />n: 7402","name: linda<br />year: 1972<br />n: 5776","name: linda<br />year: 1973<br />n: 4750","name: linda<br />year: 1974<br />n: 4102","name: linda<br />year: 1975<br />n: 3543","name: linda<br />year: 1976<br />n: 3152","name: linda<br />year: 1977<br />n: 2931","name: linda<br />year: 1978<br />n: 2950","name: linda<br />year: 1979<br />n: 2755","name: linda<br />year: 1980<br />n: 2823","name: linda<br />year: 1981<br />n: 2746","name: linda<br />year: 1982<br />n: 2806","name: linda<br />year: 1983<br />n: 2498","name: linda<br />year: 1984<br />n: 2346","name: linda<br />year: 1985<br />n: 2125","name: linda<br />year: 1986<br />n: 1973","name: linda<br />year: 1987<br />n: 1945","name: linda<br />year: 1988<br />n: 1853","name: linda<br />year: 1989<br />n: 1860","name: linda<br />year: 1990<br />n: 1670","name: linda<br />year: 1991<br />n: 1618","name: linda<br />year: 1992<br />n: 1592","name: linda<br />year: 1993<br />n: 1495","name: linda<br />year: 1994<br />n: 1294","name: linda<br />year: 1995<br />n: 1234","name: linda<br />year: 1996<br />n: 987","name: linda<br />year: 1997<br />n: 1098","name: linda<br />year: 1998<br />n: 971","name: linda<br />year: 1999<br />n: 900","name: linda<br />year: 2000<br />n: 850","name: linda<br />year: 2001<br />n: 837","name: linda<br />year: 2002<br />n: 769","name: linda<br />year: 2003<br />n: 741","name: linda<br />year: 2004<br />n: 727","name: linda<br />year: 2005<br />n: 749","name: linda<br />year: 2006<br />n: 700","name: linda<br />year: 2007<br />n: 660","name: linda<br />year: 2008<br />n: 613","name: linda<br />year: 2009<br />n: 551","name: linda<br />year: 2010<br />n: 477","name: linda<br />year: 2011<br />n: 489","name: linda<br />year: 2012<br />n: 448","name: linda<br />year: 2013<br />n: 443","name: linda<br />year: 2014<br />n: 470","name: linda<br />year: 2015<br />n: 425","name: linda<br />year: 2016<br />n: 436","name: linda<br />year: 2017<br />n: 404"],"type":"scatter","mode":"lines","line":{"width":7.55905511811024,"color":"rgba(0,191,125,1)","dash":"solid"},"hoveron":"points","name":"linda","legendgroup":"linda","showlegend":true,"xaxis":"x","yaxis":"y","hoverinfo":"text","frame":null},{"x":[1906,1911,1913,1914,1916,1917,1918,1919,1920,1921,1922,1923,1924,1925,1926,1927,1928,1929,1930,1931,1932,1933,1934,1935,1936,1937,1938,1939,1940,1941,1942,1943,1944,1945,1946,1947,1948,1949,1950,1951,1952,1953,1954,1955,1956,1957,1958,1959,1960,1961,1962,1963,1964,1965,1966,1967,1968,1969,1970,1971,1972,1973,1974,1975,1976,1977,1978,1979,1980,1981,1982,1983,1984,1985,1986,1987,1988,1989,1990,1991,1992,1993,1994,1995,1996,1997,1998,1999,2000,2001,2002,2003,2004,2005,2006,2007,2008,2009,2010,2011,2012,2013,2014,2015,2016,2017],"y":[10,6,7,9,7,8,12,6,12,17,8,10,7,14,14,9,14,6,14,15,14,11,13,11,13,14,8,21,18,13,26,34,23,35,65,102,82,102,99,105,126,146,133,178,191,277,310,405,386,390,400,645,523,1092,1592,1943,2185,2268,2355,6235,8948,10600,13314,15443,17664,21619,21914,23778,25406,27498,27293,28451,29263,30465,30212,29176,28353,28976,29699,27960,27383,27070,24412,23443,22189,20886,20671,21465,20712,18751,18177,20169,20191,18658,17115,16415,15253,13633,12432,11999,11402,10311,9686,9199,8917,8422],"text":["name: ryan<br />year: 1906<br />n: 10","name: ryan<br />year: 1911<br />n: 6","name: ryan<br />year: 1913<br />n: 7","name: ryan<br />year: 1914<br />n: 9","name: ryan<br />year: 1916<br />n: 7","name: ryan<br />year: 1917<br />n: 8","name: ryan<br />year: 1918<br />n: 12","name: ryan<br />year: 1919<br />n: 6","name: ryan<br />year: 1920<br />n: 12","name: ryan<br />year: 1921<br />n: 17","name: ryan<br />year: 1922<br />n: 8","name: ryan<br />year: 1923<br />n: 10","name: ryan<br />year: 1924<br />n: 7","name: ryan<br />year: 1925<br />n: 14","name: ryan<br />year: 1926<br />n: 14","name: ryan<br />year: 1927<br />n: 9","name: ryan<br />year: 1928<br />n: 14","name: ryan<br />year: 1929<br />n: 6","name: ryan<br />year: 1930<br />n: 14","name: ryan<br />year: 1931<br />n: 15","name: ryan<br />year: 1932<br />n: 14","name: ryan<br />year: 1933<br />n: 11","name: ryan<br />year: 1934<br />n: 13","name: ryan<br />year: 1935<br />n: 11","name: ryan<br />year: 1936<br />n: 13","name: ryan<br />year: 1937<br />n: 14","name: ryan<br />year: 1938<br />n: 8","name: ryan<br />year: 1939<br />n: 21","name: ryan<br />year: 1940<br />n: 18","name: ryan<br />year: 1941<br />n: 13","name: ryan<br />year: 1942<br />n: 26","name: ryan<br />year: 1943<br />n: 34","name: ryan<br />year: 1944<br />n: 23","name: ryan<br />year: 1945<br />n: 35","name: ryan<br />year: 1946<br />n: 65","name: ryan<br />year: 1947<br />n: 102","name: ryan<br />year: 1948<br />n: 82","name: ryan<br />year: 1949<br />n: 102","name: ryan<br />year: 1950<br />n: 99","name: ryan<br />year: 1951<br />n: 105","name: ryan<br />year: 1952<br />n: 126","name: ryan<br />year: 1953<br />n: 146","name: ryan<br />year: 1954<br />n: 133","name: ryan<br />year: 1955<br />n: 178","name: ryan<br />year: 1956<br />n: 191","name: ryan<br />year: 1957<br />n: 277","name: ryan<br />year: 1958<br />n: 310","name: ryan<br />year: 1959<br />n: 405","name: ryan<br />year: 1960<br />n: 386","name: ryan<br />year: 1961<br />n: 390","name: ryan<br />year: 1962<br />n: 400","name: ryan<br />year: 1963<br />n: 645","name: ryan<br />year: 1964<br />n: 523","name: ryan<br />year: 1965<br />n: 1092","name: ryan<br />year: 1966<br />n: 1592","name: ryan<br />year: 1967<br />n: 1943","name: ryan<br />year: 1968<br />n: 2185","name: ryan<br />year: 1969<br />n: 2268","name: ryan<br />year: 1970<br />n: 2355","name: ryan<br />year: 1971<br />n: 6235","name: ryan<br />year: 1972<br />n: 8948","name: ryan<br />year: 1973<br />n: 10600","name: ryan<br />year: 1974<br />n: 13314","name: ryan<br />year: 1975<br />n: 15443","name: ryan<br />year: 1976<br />n: 17664","name: ryan<br />year: 1977<br />n: 21619","name: ryan<br />year: 1978<br />n: 21914","name: ryan<br />year: 1979<br />n: 23778","name: ryan<br />year: 1980<br />n: 25406","name: ryan<br />year: 1981<br />n: 27498","name: ryan<br />year: 1982<br />n: 27293","name: ryan<br />year: 1983<br />n: 28451","name: ryan<br />year: 1984<br />n: 29263","name: ryan<br />year: 1985<br />n: 30465","name: ryan<br />year: 1986<br />n: 30212","name: ryan<br />year: 1987<br />n: 29176","name: ryan<br />year: 1988<br />n: 28353","name: ryan<br />year: 1989<br />n: 28976","name: ryan<br />year: 1990<br />n: 29699","name: ryan<br />year: 1991<br />n: 27960","name: ryan<br />year: 1992<br />n: 27383","name: ryan<br />year: 1993<br />n: 27070","name: ryan<br />year: 1994<br />n: 24412","name: ryan<br />year: 1995<br />n: 23443","name: ryan<br />year: 1996<br />n: 22189","name: ryan<br />year: 1997<br />n: 20886","name: ryan<br />year: 1998<br />n: 20671","name: ryan<br />year: 1999<br />n: 21465","name: ryan<br />year: 2000<br />n: 20712","name: ryan<br />year: 2001<br />n: 18751","name: ryan<br />year: 2002<br />n: 18177","name: ryan<br />year: 2003<br />n: 20169","name: ryan<br />year: 2004<br />n: 20191","name: ryan<br />year: 2005<br />n: 18658","name: ryan<br />year: 2006<br />n: 17115","name: ryan<br />year: 2007<br />n: 16415","name: ryan<br />year: 2008<br />n: 15253","name: ryan<br />year: 2009<br />n: 13633","name: ryan<br />year: 2010<br />n: 12432","name: ryan<br />year: 2011<br />n: 11999","name: ryan<br />year: 2012<br />n: 11402","name: ryan<br />year: 2013<br />n: 10311","name: ryan<br />year: 2014<br />n: 9686","name: ryan<br />year: 2015<br />n: 9199","name: ryan<br />year: 2016<br />n: 8917","name: ryan<br />year: 2017<br />n: 8422"],"type":"scatter","mode":"lines","line":{"width":7.55905511811024,"color":"rgba(0,176,246,1)","dash":"solid"},"hoveron":"points","name":"ryan","legendgroup":"ryan","showlegend":true,"xaxis":"x","yaxis":"y","hoverinfo":"text","frame":null},{"x":[1880,1881,1882,1883,1884,1885,1886,1887,1888,1889,1890,1891,1892,1893,1894,1895,1896,1897,1898,1899,1900,1901,1902,1903,1904,1905,1906,1907,1908,1909,1910,1911,1912,1913,1914,1915,1916,1917,1918,1919,1920,1921,1922,1923,1924,1925,1926,1927,1928,1929,1930,1931,1932,1933,1934,1935,1936,1937,1938,1939,1940,1941,1942,1943,1944,1945,1946,1947,1948,1949,1950,1951,1952,1953,1954,1955,1956,1957,1958,1959,1960,1961,1962,1963,1964,1965,1966,1967,1968,1969,1970,1971,1972,1973,1974,1975,1976,1977,1978,1979,1980,1981,1982,1983,1984,1985,1986,1987,1988,1989,1990,1991,1992,1993,1994,1995,1996,1997,1998,1999,2000,2001,2002,2003,2004,2005,2006,2007,2008,2009,2010,2011,2012,2013,2014,2015,2016,2017],"y":[9562,8554,9329,8427,8931,8077,8287,7514,8747,7818,7528,6813,7826,7255,7308,7317,7791,7230,7441,6109,8623,6022,6641,6346,6441,6523,6595,6933,7573,7949,8881,10643,19704,23632,29850,38693,40555,42588,45462,44147,50352,52051,51311,52360,53760,53592,52222,51802,49460,48146,47548,43507,42349,39240,40343,40358,39541,40873,42560,42231,44921,47926,55049,56067,52500,50353,60196,67140,62121,61631,60816,62888,63204,61931,61549,60072,59091,56995,54356,51521,49518,48207,45033,44659,44399,40289,38440,37807,37148,37832,39114,35633,30725,28184,27162,25734,24647,24957,24374,24892,25868,24975,25777,25577,25059,24787,24493,24368,24286,24764,24953,23921,23126,22250,21533,20204,20581,20043,20867,20734,20697,20123,20156,20021,20334,19078,18973,18907,18416,17929,17071,17367,16899,16647,16832,15904,15759,14922],"text":["name: william<br />year: 1880<br />n: 9562","name: william<br />year: 1881<br />n: 8554","name: william<br />year: 1882<br />n: 9329","name: william<br />year: 1883<br />n: 8427","name: william<br />year: 1884<br />n: 8931","name: william<br />year: 1885<br />n: 8077","name: william<br />year: 1886<br />n: 8287","name: william<br />year: 1887<br />n: 7514","name: william<br />year: 1888<br />n: 8747","name: william<br />year: 1889<br />n: 7818","name: william<br />year: 1890<br />n: 7528","name: william<br />year: 1891<br />n: 6813","name: william<br />year: 1892<br />n: 7826","name: william<br />year: 1893<br />n: 7255","name: william<br />year: 1894<br />n: 7308","name: william<br />year: 1895<br />n: 7317","name: william<br />year: 1896<br />n: 7791","name: william<br />year: 1897<br />n: 7230","name: william<br />year: 1898<br />n: 7441","name: william<br />year: 1899<br />n: 6109","name: william<br />year: 1900<br />n: 8623","name: william<br />year: 1901<br />n: 6022","name: william<br />year: 1902<br />n: 6641","name: william<br />year: 1903<br />n: 6346","name: william<br />year: 1904<br />n: 6441","name: william<br />year: 1905<br />n: 6523","name: william<br />year: 1906<br />n: 6595","name: william<br />year: 1907<br />n: 6933","name: william<br />year: 1908<br />n: 7573","name: william<br />year: 1909<br />n: 7949","name: william<br />year: 1910<br />n: 8881","name: william<br />year: 1911<br />n: 10643","name: william<br />year: 1912<br />n: 19704","name: william<br />year: 1913<br />n: 23632","name: william<br />year: 1914<br />n: 29850","name: william<br />year: 1915<br />n: 38693","name: william<br />year: 1916<br />n: 40555","name: william<br />year: 1917<br />n: 42588","name: william<br />year: 1918<br />n: 45462","name: william<br />year: 1919<br />n: 44147","name: william<br />year: 1920<br />n: 50352","name: william<br />year: 1921<br />n: 52051","name: william<br />year: 1922<br />n: 51311","name: william<br />year: 1923<br />n: 52360","name: william<br />year: 1924<br />n: 53760","name: william<br />year: 1925<br />n: 53592","name: william<br />year: 1926<br />n: 52222","name: william<br />year: 1927<br />n: 51802","name: william<br />year: 1928<br />n: 49460","name: william<br />year: 1929<br />n: 48146","name: william<br />year: 1930<br />n: 47548","name: william<br />year: 1931<br />n: 43507","name: william<br />year: 1932<br />n: 42349","name: william<br />year: 1933<br />n: 39240","name: william<br />year: 1934<br />n: 40343","name: william<br />year: 1935<br />n: 40358","name: william<br />year: 1936<br />n: 39541","name: william<br />year: 1937<br />n: 40873","name: william<br />year: 1938<br />n: 42560","name: william<br />year: 1939<br />n: 42231","name: william<br />year: 1940<br />n: 44921","name: william<br />year: 1941<br />n: 47926","name: william<br />year: 1942<br />n: 55049","name: william<br />year: 1943<br />n: 56067","name: william<br />year: 1944<br />n: 52500","name: william<br />year: 1945<br />n: 50353","name: william<br />year: 1946<br />n: 60196","name: william<br />year: 1947<br />n: 67140","name: william<br />year: 1948<br />n: 62121","name: william<br />year: 1949<br />n: 61631","name: william<br />year: 1950<br />n: 60816","name: william<br />year: 1951<br />n: 62888","name: william<br />year: 1952<br />n: 63204","name: william<br />year: 1953<br />n: 61931","name: william<br />year: 1954<br />n: 61549","name: william<br />year: 1955<br />n: 60072","name: william<br />year: 1956<br />n: 59091","name: william<br />year: 1957<br />n: 56995","name: william<br />year: 1958<br />n: 54356","name: william<br />year: 1959<br />n: 51521","name: william<br />year: 1960<br />n: 49518","name: william<br />year: 1961<br />n: 48207","name: william<br />year: 1962<br />n: 45033","name: william<br />year: 1963<br />n: 44659","name: william<br />year: 1964<br />n: 44399","name: william<br />year: 1965<br />n: 40289","name: william<br />year: 1966<br />n: 38440","name: william<br />year: 1967<br />n: 37807","name: william<br />year: 1968<br />n: 37148","name: william<br />year: 1969<br />n: 37832","name: william<br />year: 1970<br />n: 39114","name: william<br />year: 1971<br />n: 35633","name: william<br />year: 1972<br />n: 30725","name: william<br />year: 1973<br />n: 28184","name: william<br />year: 1974<br />n: 27162","name: william<br />year: 1975<br />n: 25734","name: william<br />year: 1976<br />n: 24647","name: william<br />year: 1977<br />n: 24957","name: william<br />year: 1978<br />n: 24374","name: william<br />year: 1979<br />n: 24892","name: william<br />year: 1980<br />n: 25868","name: william<br />year: 1981<br />n: 24975","name: william<br />year: 1982<br />n: 25777","name: william<br />year: 1983<br />n: 25577","name: william<br />year: 1984<br />n: 25059","name: william<br />year: 1985<br />n: 24787","name: william<br />year: 1986<br />n: 24493","name: william<br />year: 1987<br />n: 24368","name: william<br />year: 1988<br />n: 24286","name: william<br />year: 1989<br />n: 24764","name: william<br />year: 1990<br />n: 24953","name: william<br />year: 1991<br />n: 23921","name: william<br />year: 1992<br />n: 23126","name: william<br />year: 1993<br />n: 22250","name: william<br />year: 1994<br />n: 21533","name: william<br />year: 1995<br />n: 20204","name: william<br />year: 1996<br />n: 20581","name: william<br />year: 1997<br />n: 20043","name: william<br />year: 1998<br />n: 20867","name: william<br />year: 1999<br />n: 20734","name: william<br />year: 2000<br />n: 20697","name: william<br />year: 2001<br />n: 20123","name: william<br />year: 2002<br />n: 20156","name: william<br />year: 2003<br />n: 20021","name: william<br />year: 2004<br />n: 20334","name: william<br />year: 2005<br />n: 19078","name: william<br />year: 2006<br />n: 18973","name: william<br />year: 2007<br />n: 18907","name: william<br />year: 2008<br />n: 18416","name: william<br />year: 2009<br />n: 17929","name: william<br />year: 2010<br />n: 17071","name: william<br />year: 2011<br />n: 17367","name: william<br />year: 2012<br />n: 16899","name: william<br />year: 2013<br />n: 16647","name: william<br />year: 2014<br />n: 16832","name: william<br />year: 2015<br />n: 15904","name: william<br />year: 2016<br />n: 15759","name: william<br />year: 2017<br />n: 14922"],"type":"scatter","mode":"lines","line":{"width":7.55905511811024,"color":"rgba(231,107,243,1)","dash":"solid"},"hoveron":"points","name":"william","legendgroup":"william","showlegend":true,"xaxis":"x","yaxis":"y","hoverinfo":"text","frame":null}],"layout":{"margin":{"t":25.3933463796477,"r":7.30593607305936,"b":60.8669868943842,"l":101.286841012868},"plot_bgcolor":"rgba(235,235,235,1)","paper_bgcolor":"rgba(255,255,255,1)","font":{"color":"rgba(0,0,0,1)","family":"","size":26.5670402656704},"xaxis":{"domain":[0,1],"automargin":true,"type":"linear","autorange":true,"tickmode":"auto","ticktext":["1880","1920","1960","2000"],"tickvals":[1880,1920,1960,2000],"categoryorder":"array","categoryarray":["1880","1920","1960","2000"],"nticks":null,"ticks":"outside","tickcolor":"rgba(51,51,51,1)","ticklen":3.65296803652968,"tickwidth":0.66417600664176,"showticklabels":true,"tickfont":{"color":"rgba(77,77,77,1)","family":"","size":21.2536322125363},"tickangle":-0,"showline":false,"linecolor":null,"linewidth":0,"showgrid":true,"gridcolor":"rgba(255,255,255,1)","gridwidth":0.66417600664176,"zeroline":false,"anchor":"y","title":{"text":"year","font":{"color":"rgba(0,0,0,1)","family":"","size":26.5670402656704}},"hoverformat":".2f","rangeslider":{"visible":true}},"yaxis":{"domain":[0,1],"automargin":true,"type":"linear","autorange":true,"range":[-4988.75,104895.75],"tickmode":"auto","ticktext":["0","25000","50000","75000","100000"],"tickvals":[0,25000,50000,75000,100000],"categoryorder":"array","categoryarray":["0","25000","50000","75000","100000"],"nticks":null,"ticks":"outside","tickcolor":"rgba(51,51,51,1)","ticklen":3.65296803652968,"tickwidth":0.66417600664176,"showticklabels":true,"tickfont":{"color":"rgba(77,77,77,1)","family":"","size":21.2536322125363},"tickangle":-0,"showline":false,"linecolor":null,"linewidth":0,"showgrid":true,"gridcolor":"rgba(255,255,255,1)","gridwidth":0.66417600664176,"zeroline":false,"anchor":"x","title":{"text":"n","font":{"color":"rgba(0,0,0,1)","family":"","size":26.5670402656704}},"hoverformat":".2f"},"shapes":[{"type":"rect","fillcolor":null,"line":{"color":null,"width":0,"linetype":[]},"yref":"paper","xref":"paper","x0":0,"x1":1,"y0":0,"y1":1}],"showlegend":true,"legend":{"bgcolor":"rgba(255,255,255,1)","bordercolor":"transparent","borderwidth":1.88976377952756,"font":{"color":"rgba(0,0,0,1)","family":"","size":21.2536322125363},"y":0.962504686914136},"annotations":[{"text":"name","x":1.02,"y":1,"showarrow":false,"ax":0,"ay":0,"font":{"color":"rgba(0,0,0,1)","family":"","size":26.5670402656704},"xref":"paper","yref":"paper","textangle":-0,"xanchor":"left","yanchor":"bottom","legendTitle":true}],"hovermode":"x","barmode":"relative"},"config":{"doubleClick":"reset","showSendToCloud":false},"source":"A","attrs":{"73c46d4c8130":{"colour":{},"x":{},"y":{},"type":"scatter"}},"cur_data":"73c46d4c8130","visdat":{"73c46d4c8130":["function (y) ","x"]},"highlight":{"on":"plotly_click","persistent":false,"dynamic":false,"selectize":false,"opacityDim":0.2,"selected":{"opacity":1},"debounce":0},"shinyEvents":["plotly_hover","plotly_click","plotly_selected","plotly_relayout","plotly_brushed","plotly_brushing","plotly_clickannotation","plotly_doubleclick","plotly_deselect","plotly_afterplot","plotly_sunburstclick"],"base_url":"https://plot.ly"},"evals":[],"jsHooks":[]}</script> --- ## `gganimate` for Fun * Convert svgs to csvs with [coordinator](https://spotify.github.io/coordinator/) * Create an animation with `gganimate` ```r hats <- read_csv(here::here("slides/hats.csv")) hats1 <- hats %>% filter(y <= 325) %>% arrange(x) hats2 <- hats %>% filter(y > 325) %>% arrange(x) hats_all <- bind_rows(hats1, hats2) %>% mutate(slide = row_number()) hats_gif <- ggplot(hats_all, aes(x=x, y=y)) + theme_void() + scale_y_reverse() + theme(plot.background = element_rect(fill = '#CA302F')) + geom_point(colour = 'white', size = 1) + transition_manual(slide, cumulative=TRUE) ``` --- ```r animate(hats_gif, end_pause = 30) ``` <!-- -->