Schedule
Missed Class
If you are unable to attend class, you can still earn participation credit by completing the following activity:
Watch the day’s lecture video (which will usually be posted by around 3pm PST).
Write a short response to the video that includes:
A 1 - 2 paragraph summary of the main ideas and topics discussed.
A 1 - 2 paragraph discussion of 1 real-world example of the theory, method or application in the lecture that has pertinence to your life, or was in the news, or that you’ve found interesting; for example, the lecture may have discussed the decomposition of an image using the grammar of graphics, and you could find one image from a newsroom and discuss the
geommetric shapes,aesthetic attributes, anddatavariables that appear in this image.One question you have about the content covered in the lecture video.
Send your response to Nate on Slack (either as a message or attached image / .pdf file) before the start of the next class day.
Week 1
Monday 1-25
Lecture Video (requires Reed Kerberus credentials to watch)
Topics
Course structure
Statistical Thinking (Small Group Discussion)
Reading Assignment
Note that the listed reading assignments should be completed prior to class
- Review the class syllabus
Wednesday 1-27
Lecture Video (requires Reed Kerberus credentials to watch)
Topics
R and RStudio
Structure of Data
Reading Assignment
Note that the listed reading assignments should be completed prior to class
Read Sections 1.1 - 1.4 in ModernDive
Complete Learning Checks LC 1.4, LC 1.5, LC 1.6 and submit to Gradescope.
Due
Note that the listed assignments should be completed prior to class
- Complete Slack Introduction:
- Sign-in to our Slack workspace
- Navigate to the #general-discussion channel using the menu on the left side of the screen and post a message with your name and statistics that describe yourself, two of which are true and one of which is false (don’t say which is which).
- Find another person’s post, hover over it, and click the chat bubble icon to start a thread. Then guess which of that person’s three statements is false.
- Finally, find my name (Nate Wells) under Direct Messages on the left side of the screen, and send me a private message answering the following questions:
- What is your preferred name? (and what are your pronouns, if you’d like to share?)
- Have you taken a statistics course previously?
- What do you hope to take away from this course?
- What concerns do you have about this course, or about academics in general this term?
- What is one image that best describes you? (feel free to upload it)
Friday 1-29
Lecture Video (requires Reed Kerberus credentials to watch)
Topics
- The Grammar of Graphics
Reading Assignment
Note that the listed reading assignments should be completed prior to class
Sections to Read Sections 2.1 and 2.2 in ModernDive
Reading Questions (Submit answers on Gradescope)
- Suppose you need to describe to someone else, who has never plotted points on a graph before, a general method for plotting several points on a graph (that is, by drawing them out by hand on a piece of paper). In a short paragraph, provide instructions for this person how to plot the points (1, 5), (2, 3), and (3, 5) on a piece of paper. (To reiterate, assume this person has never plotted before, so does not have a prior model to reference or imitate).
Week 2
Monday 2-1
Lecture Video (requires Reed Kerberus credentials to watch)
Topics
- Exploring
ggplot2: Scatterplots, Linegraphs and Histograms
Reading Assignment
Note that the listed reading assignments should be completed prior to class
Sections to Read Sections 2.3 - 2.5 in ModernDive
Reading Questions (Submit answers on Gradescope)
- Answer LC2.6, LC2.11, LC2.16 from the text
Wednesday 2-3
Lecture Video (requires Reed Kerberus credentials to watch)
Topics
- Exploring
ggplot2: Boxplots, Barplots and More!
Reading Assignment
Note that the listed reading assignments should be completed prior to class
Sections to Read Sections 2.6 - 2.9 in ModernDive
Reading Questions (Submit answers on Gradescope)
- Answer LC2.20, LC2.25, LC2.27 from the text
Week 2 Lab
Topics
- Data Visualization with
ggplot2
Lab Assignment
- Lab 2 (posted on Thursday 2/4)
Lab Assignment Due
Previous week’s lab assignment due on Gradescope before the start of your lab section
- Lab 1
Friday 2-5
Lecture Video (requires Reed Kerberus credentials to watch)
Topics
- Summarizing Data: Measures of Shape, Center, and Spread
Reading Assignment
Note that the listed reading assignments should be completed prior to class
Sections to Read Sections 1.6 and 1.7 in OpenIntro: ISRS Note this is not the ModernDive textbook
Reading Questions (Submit answers on Gradescope)
What are two different values that can be used to measure the center of a quantitative data set? What are two different values that can be used to measure the spread of a quantitative data set?
Describe how to use the mean and median together in order to determine the skew of a distribution.
True or false? We can compute the mean value of a categorical data set.
Week 3
Monday 2-8
Lecture Video (requires Reed Kerberus credentials to watch)
Topics
- Data Wrangling: The Pipe and Summarizing
Reading Assignment
Note that the listed reading assignments should be completed prior to class
Sections to Read Sections 3.1, 3.3, 3.4 in ModernDive
Reading Questions (Submit answers on Gradescope)
What is one “problem” the pipe operator solves when coding?
Answer LC3.2, LC3.6 from the text
Wednesday 2-10
Lecture Video (requires Reed Kerberus credentials to watch)
Topics
Data Wrangling: Filtering, Selecting, and Mutating
Reading Assignment
Note that the listed reading assignments should be completed prior to class
Sections to Read Sections 3.2, 3.5 - 3.9 in ModernDive
Reading Questions (Submit answers on Gradescope)
- Suppose you have a data frame
toddleswith two variables,weightandheight, with observations from 30 toddlers. Explain why the followign code will produce an error:
- Suppose you have a data frame
toddlers %>%
  filter(weight) %>%
select(weight < 20)- Answer LC3.12, LC3.18 from the text For LC3.12, just include a text answer. you don’t need to include the graphics or summary data in your submission to gradescope.
Week 3 Lab
Topics
- Data Wrangling with
dplyr
Lab Assignment
- Lab 3 (posted on Thursday 2/11)
Lab Assignment Due
Previous week’s lab assignment due on Gradescope before the start of your lab section
- Lab 2
Friday 2-12
Lecture Notes (see the More Data Wrangling key below)
Lecture Video (requires Reed Kerberus credentials to watch)
Topics
Data Wrangling: More!
Reading Assignment
Note that the listed reading assignments should be completed prior to class
Sections to Read None
Reading Questions (Submit answers on Gradescope)
- None
Week 4
Monday 2-15
All Reed College classes (online and in-person) canceled Monday 2-15 due to inclement weather.
The reading assignment previously due 7am Monday is extended to 7am Friday and has been relabeled DR 2-19.
Wednesday 2-17
All Reed College classes (online and in-person) canceled Wednesday 2-17 due to inclement weather.
The reading assignment previously due 7am Monday is extended to 7am Friday and has been relabeled DR 2-19.
Week 4 Lab
Topics
- Data Collection
Lab Assignment
- Lab 4 (posted on Thursday 2/18)
Lab Assignment Due
Previous week’s lab assignment due on Gradescope before the start of your lab section
- Lab 3
Friday 2-19
Lecture Video (requires Reed Kerberus credentials to watch)
Topics
Principals of Data Collection
Reading Assignment
Note that the listed reading assignments should be completed prior to class
This reading assignment was originally due 7am Monday, but the deadline was extended to 7am Wednesday, and then again to 7am Friday due to canceled class. If you already submitted the assignment for Monday, there is nothing extra you need to submit for Friday
Sections to Read Sections 1.3 - 1.5 in OpenIntro: ISRS
Reading Questions (Submit answers on Gradescope)
The website Rotten Tomatoes shows a proportion of audience respondents who were satisfied with a film. If a particular film has an audience score of 50%, do you think this means that 50% of all audience members are dissatisfied with the film? Why or why not?
Consider the following two research question. What is the implied population? And what represents as an individual case?
Have daily high temperature readings increased in Portland, OR over the past 20 years?
Does the Moderna COVID-19 vaccine reduce the death rate in patients with severe cases of COVID-19?
Week 5
Monday 2-22
Lecture Video (requires Reed Kerberus credentials to watch)
Topics
- Principals of Data Collection
Reading Assignment
Note that the listed reading assignments should be completed prior to class
Sections to Read REVIEW Sections 1.3 - 1.5 in OpenIntro: ISRS
Reading Questions (Submit answers on Gradescope)
An observational study shows strong correlation between adolescent marijuana use and psychiatric disorders. Can we conclude that marijuana use causes psychiatric disorders? Can we conclude that marijuana use does not cause psychiatric disorders?
Give an example of a randomized experiment where it might be unwise or unethical to incorporate a placebo.
Wednesday 2-24
Lecture Video (requires Reed Kerberus credentials to watch)
Topics
- Linear Models
Reading Assignment
Note that the listed reading assignments should be completed prior to class
Sections to Read Sections 5.1 - 5.2 (just through 5.2.2) in OpenIntro: ISRS
Reading Questions (Submit answers on Gradescope)
If a model underestimates an observation, will the residual be positive or negative? What about if it overestimates the observation?
Suppose the scores on a statistics midterm and final exam are positively correlated. Do we have enough information to know whether the students tend to do better on the final exam than the midterm? Explain.
Week 5 Lab
Topics
- Linear Models
Lab Assignment
- Lab 5 (posted on Thursday 2/25)
Lab Assignment Due
Previous week’s lab assignment due on Gradescope before the start of your lab section
- Lab 4
Friday 2-26
Lecture Video (requires Reed Kerberus credentials to watch)
Topics
- Linear Models
Reading Assignment
Note that the listed reading assignments should be completed prior to class
Sections to Read Chapter 5 Intro and sections 5.1 and 5.3 in ModernDive
Reading Questions (Submit answers on Gradescope)
LC 5.1 (you don’t need to include your actual data or visualization, just your response to the question)
What is the largest difference between the treatment of Linear Regression in ModernDive Section 5.1 and its treatment in OpenIntro Section 5.1. i.e.What are you able to do after reading ModernDive that you weren’t able to do with just OpenIntro?
Week 6
Monday 3-1
Lecture Video (requires Reed Kerberus credentials to watch)
Topics
- Regression with Categorical Variables
Reading Assignment
Note that the listed reading assignments should be completed prior to class
Sections to Read Section 5.2 in ModernDive
Reading Questions (Submit answers on Gradescope)
- LC 5.4 (You don’t need to include your actual data or visualizations), just your responses to the questions.
- LC 5.6
- What is one essential difference between regression models comparing 2 quantitative variables, and regression models comparing a quantitative and categorical variable?
Wednesday 3-3
Lecture Video (requires Reed Kerberus credentials to watch)
Topics
- Survey of Multilinear Models
Reading Assignment
Note that the listed reading assignments should be completed prior to class
Sections to Read Section 6.1 in ModernDive
Reading Questions (Submit answers on Gradescope)
What is one essential difference between the interaction model and the parallel slopes model for multiple linear regression?
What is one conclusion we could draw from either the interaction or parallel slopes model for UT Austin evaluation scores in Section 6.1, that we could not draw from the simple linear model for UT Austin evaluation scores as a function of age (as in Section 5.1)?
Week 6 Lab
Topics
- Review Linear Models
Lab Assignment
- None
Lab Assignment Due
Previous week’s lab assignment due on Gradescope before the start of your lab section
- Lab 5
Friday 3-5
Topics
- Review
Midterm
- Midterm 1 available on gradescope at 5pm (due 10am Monday on Gradescope). For more info, see Exam page.
Reading Assignment
Note that the listed reading assignments should be completed prior to class
Sections to Read None
Reading Questions (Submit answers on Gradescope)
What is one topic you’d like to review during class on Friday? (be as specific as possible)
What is one question you’d like to have answered during class on Friday?
Week 7
Monday 3-8
Lecture Video (requires Reed Kerberus credentials to watch)
Topics
Random Sampling
-
10am Jamboard (requires Reed Kerberus credentials to view)
11am Jamboard (requires Reed Kerberus credentials to view)
Reading Assignment
Note that the listed reading assignments should be completed prior to class
Sections to Read 7.1 and 7.2 (this reading is suggested, but not required)
Reading Questions (Submit answers on Gradescope)
- None
Wednesday 3-10
Lecture Video (requires Reed Kerberus credentials to watch)
Topics
- The Sampling Distribution
Reading Assignment
Note that the listed reading assignments should be completed prior to class
Sections to Read Section 7.3 and 7.4 in ModernDive
Reading Questions (Submit answers on Gradescope)
- LC 7.13, 7.15, 7.17
Week 7 Lab
Topics
- Sampling
Lab Assignment
- Lab 6 (posted on Thursday 3/11)
Lab Assignment Due
Previous week’s lab assignment due on Gradescope before the start of your lab section
- None
Friday 3-12
Lecture Video (requires Reed Kerberus credentials to watch)
Topics
- Bootstrapping
Reading Assignment
Note that the listed reading assignments should be completed prior to class
Sections to Read Section 7.1, 7.2, 8.1, 8.2 in ModernDive
Reading Questions (Submit answers on Gradescope)
- LC 7.3, 8.1, 8.2
Week 8
Monday 3-15
Lecture Video (requires Reed Kerberus credentials to watch)
Topics
- Bootstrap Confidence Intervals
Reading Assignment
Note that the listed reading assignments should be completed prior to class
Sections to Read 8.3 and 8.4 in ModernDive
Reading Questions (Submit answers on Gradescope)
LC 8.3
What is one advantage offered by the
inferpackage method for bootstrap confidence intervals compared to the “original workflow” discussed at the start of Section 8.4?
Wednesday 3-17
Lecture Video (requires Reed Kerberus credentials to watch)
Topics
- Interpreting Confidence Intervals
Reading Assignment
Note that the listed reading assignments should be completed prior to class
Sections to Read Section 8.5 through 8.7 in ModernDive
Reading Questions (Submit answers on Gradescope)
Suppose we want to construct two confidence intervals for a population parameter, both based on the same sample of size 100. The first interval should be at the 95% confidence level, while the second should be at the 99.7% confidence level. Which interval is larger, and why?
Theory-based confidence intervals were used for much of the 20th century, and still frequently appear in statistics literature. What is one downside of the theory-based method compared to the bootstrap method?
Week 8 Lab
Topics
- Confidence Intervals
Lab Assignment
- Lab 7 (posted on Thursday 3/18)
Lab Assignment Due
Previous week’s lab assignment due on Gradescope before the start of your lab section
- Lab 6
Friday 3-19
Lecture Video (requires Reed Kerberus credentials to watch)
Topics
Testing Hypotheses
Reading Assignment
Note that the listed reading assignments should be completed prior to class
Sections to Read Section 9.1 and 9.2 in ModernDive
Reading Questions (Submit answers on Gradescope)
In your own words, briefly explain what the null distribution for a test statistic represents.
Suppose Nate has a coin that he flips repeatedly, recording the results. What type of evidence from the sequence of heads / tails would convince you that the coin is not fair?
Week 9
Monday 3-22
Lecture Video (requires Reed Kerberus credentials to watch)
Topics
- Framework for Hypothesis Testing
Reading Assignment
Note that the listed reading assignments should be completed prior to class
Sections to Read Section 2.1 - 2.4 in OpenIntro: ISRS Note this is not the ModernDive textbook
Reading Questions (Submit answers on Gradescope)
- The Reed J-Board adjudicates complaints of honor code violations in the Reed community. When the board receives a complaint, they proceed under the presumption of innocence for the accused party. Following fact-finding and deliberation, the J-Board determines whether the events in question constitute a breach of the Honor Principle, and if so, recommends potential consequences. Suppose the J-Board receives a complaint that a certain community member drew graffiti in an inappropriate location on campus.
Based on the J-board adjudication process, what are the appropriate Null and Alternative hypotheses? Be sure to explain how you knew which hypothesis should be the Null hypothesis.
What are the consequences of a Type I and Type II error in this case.
What could the J-Board do to reduce the rate of Type I errors? What would the effect of this decision be on the rate of Type II errors?
Wednesday 3-24
Lecture Video (requires Reed Kerberus credentials to watch)
Topics
- Hypothesis Testing using
infer
Reading Assignment
Note that the listed reading assignments should be completed prior to class
Sections to Read Section 9.3 and 9.4 in ModernDive
Reading Questions (Submit answers on Gradescope)
- LC 9.3, 9.4, 9.8
Week 9 Lab
Topics
- Hypothesis Testing
Lab Assignment
- Lab 8 (posted on Thursday 3/25)
Lab Assignment Due
Previous week’s lab assignment due on Gradescope before the start of your lab section
- Lab 7
Friday 3-26
Lecture Video (requires Reed Kerberus credentials to watch)
Topics
Reading Assignment
Note that the listed reading assignments should be completed prior to class
Sections to Read Section A.1 and A.2 (Appendices) in OpenIntro: ISRS Note this is not the ModernDive textbook
Reading Questions (Submit answers on Gradescope)
- Briefly explain why the following situation is not a contradiction of the Law of Large Numbers:
“A fair coin is flipped 10 times and lands heads each time.”
Suppose a fair coin is flipped 10 times. What is the probability that all 10 flips are heads? What is the probability that either all 10 flips are heads or all 10 flips are tails?
Suppose a fair coin is flipped twice. What is the conditional probability that the second flip is a heads given that neither flip is tails?
Week 10
Monday 3-29
Lecture Video (requires Reed Kerberus credentials to watch)
Topics
- Probability and Random Variables
Reading Assignment
Note that the listed reading assignments should be completed prior to class
Sections to Read Section 3.4 - 3.5 in THIS EXCERPT from OpenIntro Statistics Note: This is neither the ModernDive textbook nor the other OpenIntro: ISRS textbook.
Reading Questions (Submit answers on Gradescope)
In your own words, describe the difference between a quantitative variable and a random variable.
Give an example of a random process you think could be well-represented by a discrete random variable. Give an example of a different random process you think could be well-represented by a continuous random variable.
Suppose we model the length of a randomly selected earthworm as a continuous variable with mean 14 inches. What is the probability that the length of a randomly selected earthworm is exactly 14 inches? Explain.
Wednesday 3-31
Lecture Video (requires Reed Kerberus credentials to watch)
Topics
The Normal Distribution
The Central Limit Theorem
Reading Assignment
Note that the listed reading assignments should be completed prior to class
Sections to Read Sections 2.5 - 2.7 in OpenIntro: ISRS Note this is not the ModernDive textbook
Reading Questions (Submit answers on Gradescope)
The Quincunx, bean machine, or ``Galton Board’’ was invented by 19th century English scientist Sir Francis Galton to demonstrate fundamental principles in probability and statistics. In its basic form, the Quincunx consists of an upright triangular board with evenly spaced pegs lying above evenly spaced bins. Balls are dropped one-by-one from a central chute at the top of the board and bounce either left or right as they hit the pegs. Eventually, they are collected in the bins at the bottom of the board.
Spend some time playing around with the Galton Board here. (After you adjust sliders, be sure to hit the “restart” button as well.)
Viewing the stacks of balls at the bottom of the board as a histogram, what named distribution is the histogram similar to?
What effect does increasing the size slider have on the shape of the histogram? What effect does increasing the Left/Right slider have on the shape?
What effect does increasing the Speed slider have on the shape?
During which time interval will the shape of the histogram change more? (a) between the 1st and the 100th balls, or (b) between the 901st and 1000th balls? Explain.
Week 10 Lab
Topics
- Probability
Lab Assignment
- Lab 9 (posted on Thursday 4/1)
Lab Assignment Due
Previous week’s lab assignment due on Gradescope before the start of your lab section
- Lab 8
Friday 4-2
Lecture Notes (Central Limit Theorem begins in Section 3)
Lecture Video (requires Reed Kerberus credentials to watch)
Topics
Review
Reading Assignment
Note that the listed reading assignments should be completed prior to class
Sections to Read None
Reading Questions (Submit answers on Gradescope)
What is one topic you’d like to review during class on Friday? (be as specific as possible)
What is one question you’d like to have answered during class on Friday?
Week 11
Monday 4-5
Lecture Video (requires Reed Kerberus credentials to watch)
Topics
- Inference for Proportions
Reading Assignment
Note that the listed reading assignments should be completed prior to class
Sections to Read Section 3.1 - 3.2 in OpenIntro: ISRS Note this is not the ModernDive textbook
Reading Questions (Submit answers on Gradescope)
None
Wednesday 4-7
Lecture Video (requires Reed Kerberus credentials to watch)
Topics
- Statistical Inference for 2 proportions
Reading Assignment
Note that the listed reading assignments should be completed prior to class
Sections to Read Section 3.2 in OpenIntro: ISRS Note this is not the ModernDive textbook
Reading Questions (Submit answers on Gradescope)
In order to perform hypothesis testing or create confidence intervals based on a difference in sample proportions \(\hat p_1 - \hat p_2\), we need to check 2 conditions. What are those conditions?
Suppose you perform two 2-sided hypothesis tests for a difference in proportion. In the first test, you obtain a test statistic of \(t = -2.05\) and in the second test, you obtain a test statistic of \(t = 0.04\). Which test gives better evidence to reject the null hypothesis? Explain.
Week 11 Lab
Topics
- Statistical Inference for Categorical Data
Lab Assignment
- Lab 10 (posted on Thursday 4/8)
Lab Assignment Due
Previous week’s lab assignment due on Gradescope before the start of your lab section
- Lab 9
Friday 4-9
Lecture Video (requires Reed Kerberus credentials to watch)
Topics
- The Chi-Squared Test
Reading Assignment
Note that the listed reading assignments should be completed prior to class
Sections to Read Sections 3.3 and 3.4 in OpenIntro: ISRS Note this is not the ModernDive textbook
Reading Questions (Submit answers on Gradescope)
Suppose you perform a Chi-Square test for Goodness of Fit and obtain a chi-square statistic of \(\chi^2 = 40\). What do you need to know about the response variable and/or the sample to determine whether this large statistic gives good evidence to reject the null hypothesis?
Describe 1 similarity and 1 difference between the Chi-Squared Test for Independence and the Hypothesis Test for Difference in 2 Proportions.
Week 12
Monday 4-19
Lecture Video (requires Reed Kerberus credentials to watch)
Topics
- Inference for Means
Reading Assignment
Sections to Read Sections 4.1 and 4.2 in OpenIntro: ISRS Note this is not the ModernDive textbook
Reading Questions (Submit answers on Gradescope)
Describe at least 1 similarity and 1 difference between a t distribution and the standard Normal distribution.
Suppose you are interested in investigating the typical course load for Reed students. You obtain a random sample of 25 Reed students and record the number of credits each is currently taking as the variable
credits. If you want to perform inference using thecreditsvariable, is the parameter of interest a mean or a proportion? Explain how you know.
Wednesday 4-21
Lecture Video (requires Reed Kerberus credentials to watch)
Topics
- Inference for 2 means
Reading Assignment
Note that the listed reading assignments should be completed prior to class
Sections to Read Sections 4.2 and 4.3 (skip the section on Pooled standard deviation in 4.3) in OpenIntro: ISRS Note this is not the ModernDive textbook
Reading Questions (Submit answers on Gradescope)
A study wishes to determine whether automatic and manual transmission cars have the same fuel efficiency. They randomly select 10 automatic cars and 10 manual cars, and measure number of gallons of gas consumed by each after a 100 mile trip. Write null and alternative hypotheses for this research question, both in words and in symbols.
Consider the following two experiments. Which has matched pairs design and which corresponds to two independent samples? Explain how you know.
Does marijuan assist in injury recovery? A randomized experiment assigns subjects with sprained ankles into two groups: 10 receive a THC brownie every evening for 14 days, while another 10 receive an ordinary brownie every evening for the same period. The number of days until symptoms disappear is recorded for each subject.
A campus organization wants to determine whether listening to rock music before bed has an effect on length of sleep. They recruit 20 students and have them track the number of hours they sleep each night over a 14 day period. After these two weeks, the organization then instructs each of the 20 students to listen to rock music for 1 hour each night before going to sleep, and track the number of hours they get each night over a 14 day period. The organization records the average number of hours each student sleeps with and without rock music.
Week 12 Lab
Topics
- Statistical Inference for Quantitative Data
Lab Assignment
- Lab 11 (posted on Thursday 4/22)
Lab Assignment Due
Previous week’s lab assignment due on Gradescope before the start of your lab section
- Lab 10
Friday 4-23
Lecture Video (requires Reed Kerberus credentials to watch)
Topics
- The ANOVA Test
Reading Assignment
Note that the listed reading assignments should be completed prior to class
Sections to Read Sections 4.4 in OpenIntro: ISRS Note this is not the ModernDive textbook
Reading Questions (Submit answers on Gradescope)
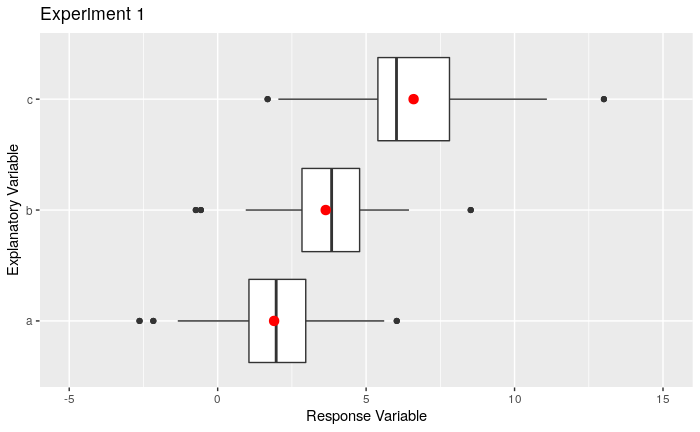
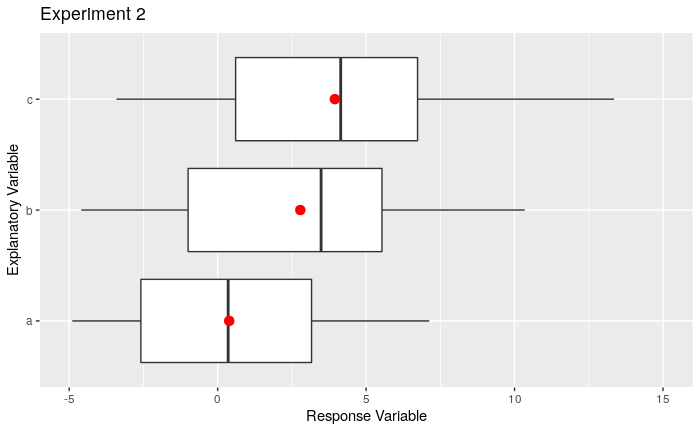
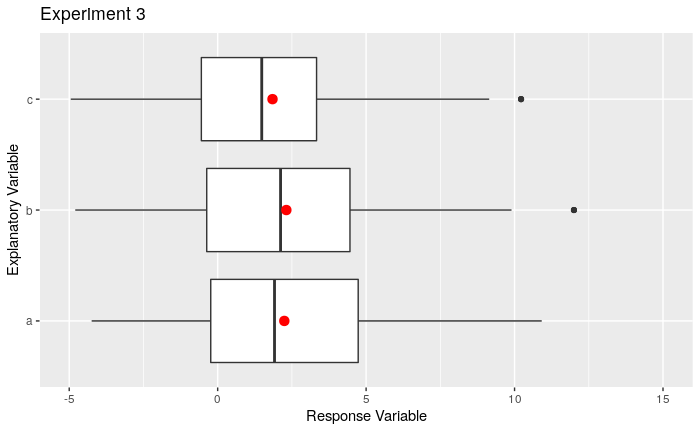
Suppose you are interested in knowing whether a certain date in April is associated with higher than average number of births. To answer this question, you look at the average number of births for each of the 30 days, based data from 100 hospitals, and find that on April 23rd, there is a statistically significant difference at the 5% level in the number of births compared to the overall average. Explain why it would be incorrect to conclude that this gives good evidence that in general, there are more births on average on April 23rd? (Think about how many different tests you are performing at the 5% level)
Consider the 3 sets of boxplots shown below. Which set gives the strongest evidence of a difference in means? Explain. Solid red dots in each box represent the means for each group
Week 13
Monday 4-26
Lecture Video (requires Reed Kerberus credentials to watch)
Topics
- Inference for Regression
Reading Assignment
Sections to Read Sections 5.4 (review 5.1, 5.2, 5.3 for refresher on linear regression) in OpenIntro: ISRS Note this is not the ModernDive textbook
Reading Questions (Submit answers on Gradescope)
- The scatterplot, residual plot, and histogram of residuals for variables \(Y\) and \(X\) are shown below. Discuss any concerns you might have about whether the data satisfies the conditions for making inference about linear regression, based on these plots.
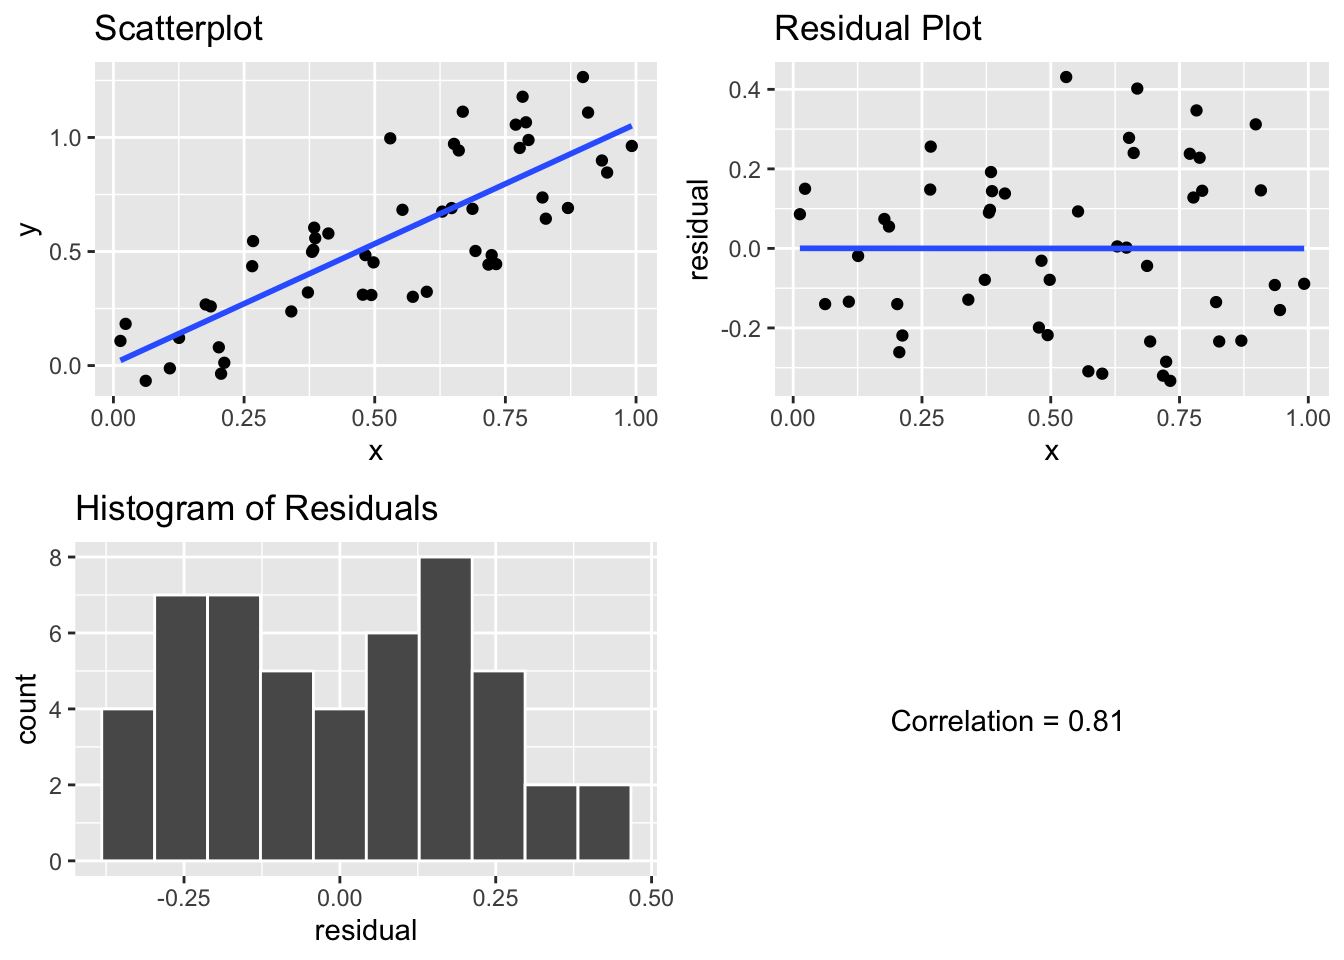
- Briefly explain what the methods of Section 5.4 allow us to do with linear regression that we couldn’t previously do based just on Sections 5.1 - 5.3.
Wednesday 4-28
Lecture Video (requires Reed Kerberus credentials to watch)
Topics
- Multiple Linear Regression
Reading Assignment
Note that the listed reading assignments should be completed prior to class
Sections to Read Sections 6.1 in OpenIntro: ISRS Note this is not the ModernDive textbook
Reading Questions (Submit answers on Gradescope)
- Suppose we create a multiple regression model predicting a penguin’s bill length based on two variable: flipper length (mm) and body mass (kg). The equation for this model is shown below.
\[ \textrm{bill length} = -4 + 0.25 \cdot\textrm{flipper length} + 0.55\cdot \textrm{body mass} \]
What does the coefficent of \(0.55\) mean in the context of the model?
What does the coefficient \(-4\) mean in the context of the model?
Suppose a penguin had bill length of 40 mm, a flipper length of 181 mm and a body mass of 3.75 kg. What is the residual for this observation?
Suppose this model has an \(R^2\) value of \(0.4281\). Do you expected the adjusted \(R^2\) value to be larger or smaller than this value?
Week 13 Lab
Topics
- Multiple Linear Regression
Lab Assignment
Lab 12 (posted on Thursday 4/28)
- It is strongly recommended that you work through Lab Assignment 12. However, submitting the assignment is optional. If you choose to submit it, it will be due by Monday, May 10th at 9am, and your score on the lab will replace your lowest lab score.
Lab Assignment Due
Previous week’s lab assignment due on Gradescope before the start of your lab section
- Lab 11
Friday 4-30
Lecture Video (requires Reed Kerberus credentials to watch)
Topics
- Model Selection
Reading Assignment
Note that the listed reading assignments should be completed prior to class
Sections to Read Sections 6.2 in OpenIntro: ISRS Note this is not the ModernDive textbook
Reading Questions (Submit answers on Gradescope)
- The percentage of a person’s weight that is made up of body fast is often used as an indicator of health and fitness. However, accurate methods of measuring percent body fat directly are difficult to implement, so an alternative is to develop a model based on body characteristics like height and weight that are easy to measure. A multiple linear regression model was computed for a sample of 100 men, with results summarized in the following table:
## # A tibble: 3 x 7
##   term      estimate std_error statistic p_value lower_ci upper_ci
##   <chr>        <dbl>     <dbl>     <dbl>   <dbl>    <dbl>    <dbl>
## 1 intercept   71.5      16.2        4.41       0   39.3    104.
## 2 Weight       0.232     0.024      9.72       0    0.184    0.279
## 3 Height      -1.34      0.259     -5.16       0   -1.85    -0.822
True or false? Since Height has a p-value of 0, we have good evidence that there is no relationship between Height and Body Fat. (Explain your answer)
The Weight estimate is much smaller than others in the model. Does this mean that Weight is superfluous to the MLR? Does this give good evidence that the true value of the Weight parameter is 0?
- Suppose we build a second model for Body Fat which also includes abdominal circumference in inches. The regression table is shown below. Is this a better model than the model constructed in problem 1? Explain.
## # A tibble: 4 x 7
##   term      estimate std_error statistic p_value lower_ci upper_ci
##   <chr>        <dbl>     <dbl>     <dbl>   <dbl>    <dbl>    <dbl>
## 1 intercept  -56.1      18.1      -3.10    0.003  -92.1    -20.1
## 2 Weight      -0.176     0.047    -3.72    0       -0.269   -0.082
## 3 Height       0.102     0.244     0.417   0.678   -0.383    0.587
## 4 Abdomen      1.08      0.116     9.28    0        0.845    1.30