Schedule
Missed Class
If you are unable to attend class, you can still earn participation credit by completing the following activity:
Watch the day’s lecture video (which will usually be posted by around 3pm PST).
Write a short response to the video that includes:
A 1 - 2 paragraph summary of the main ideas and topics discussed.
A 1 - 2 paragraph discussion of 1 real-world example of the theory, method or application in the lecture that has pertinence to your life, or was in the news, or that you’ve found interesting; for example, the lecture may have discussed the decomposition of an image using the grammar of graphics, and you could find one image from a newsroom and discuss the
geommetric shapes,aesthetic attributes, anddatavariables that appear in this image.One question you have about the content covered in the lecture video.
Send your response to Nate on Slack (either as a message or attached image / .pdf file) before the start of the next class day.
Week 1
Monday 1-24
Lecture Video (Reed Kerberus log-in required)
Topics
Course structure
Reading Assignment
Note that the listed reading assignments should be completed prior to class
- Review the class syllabus
Supplementary Material
Here is a link to the Tampa Bay Times article on race and the Stand Your Ground defense from which today’s data was taken.
Here is an article by Jeff Witmer, who did some analysis on the TBT data.
Here is a short video (~4 min) further discussing the statistical phenomenon of Simpson’s Paradox that we observed in class today.
Wednesday 1-26
Topics
R and RStudio
Structure of Data
Reading Assignment
Note that the listed reading assignments should be completed prior to class
Read Sections 1.1 - 1.4 in ModernDive
Complete Learning Checks LC 1.4, LC 1.5, LC 1.6 and submit to Gradescope.
Due
Note that the listed assignments should be completed prior to class
- Complete Slack Introduction:
- Sign-in to our Slack workspace
- Navigate to the #classroom-wells channel using the menu on the left side of the screen and post a message with your name and statistics that describe yourself, two of which are true and one of which is false (don’t say which is which). After at least 1 person has guessed, you can respond with the correct answer.
- Find another person’s post, hover over it, and click the chat bubble icon to start a thread. Then guess which of that person’s three statements is false.
- Finally, find my name (Nate Wells) under Direct Messages on the left side of the screen, and send me a private message answering the following questions:
- What is your preferred name? (and what are your pronouns, if you’d like to share?)
- Have you taken a statistics course previously?
- What do you hope to take away from this course?
- What concerns do you have about this course, or about academics in general this term?
- What is one image that best describes you? (feel free to upload it)
Supplementary Material
Here is complete
Netflixdataset that was discussed in class today: Netflix.csvThis data set was obtained from the TidyTuesday project here.
TidyTuesday is a weekly data investigation project organized by a group of data scientists, with the purpose to practice and collaborate on data summarizing and arranging tasks.
Week 1 Lab
Topics
- Introduction to R and RStudio
Friday 1-28
Topics
- The Grammar of Graphics
Reading Assignment
Note that the listed reading assignments should be completed prior to class
Sections to Read Sections 2.1 and 2.2 in ModernDive
Reading Questions (Submit answers on Gradescope)
- Suppose you need to describe to someone else, who has never plotted points on a graph before, a general method for plotting several points on a graph (that is, by drawing them out by hand on a piece of paper). In a short paragraph, provide instructions for this person how to plot the points (1, 5), (2, 3), and (3, 5) on a piece of paper. (To reiterate, assume this person has never plotted before, so does not have a prior model to reference or imitate).
Supplementary Material
An in-depth discussion of the graphical reasoning surrounding the Challenger disaster can be found in Edward Tufte’s booklet Visual and Statistical Thinking: Displays of Evidence for Making Decisions (available for check-out in the Reed library)
In 1986, President Reagan a presidential commission tasked with investigating the Space Shuttle Challenger distaster. Their findings were given in the Rogers Commission Report, and summarized in live congressional testimony.
- One of the most famous moments of the congressional testimony was the demonstration by renowned physicist, Richard Feynman, of the failure of O-rings at low temperatures. Here is a 1-minute video clip of his demo.
Week 2
Monday 1-31
Note: Class will be held remotely on Zoom on Monday, 1-31. The zoom link is available in the #announcements-wells channel of our Slack workspace.
Topics
- Exploring
ggplot2: Scatterplots, Linegraphs and more
Reading Assignment
Note that the listed reading assignments should be completed prior to class
Sections to Read Sections 2.3 - 2.5 in ModernDive
Reading Questions (Submit answers on Gradescope)
- Answer LC2.6, LC2.11, LC2.16 from the text
Wednesday 3-2
Topics
ggplot2continued: Histograms, Boxplots, Barcharts, and customization
Reading Assignment
Note that the listed reading assignments should be completed prior to class
Sections to Read Sections 2.6 - 2.9 in ModernDive
Reading Questions (Submit answers on Gradescope)
- Answer LC2.20, LC2.25, LC2.27 from the text
Supplementary Material
Portland Biketown is a bike-sharing system owned by the Portland Bureau of Transportation, managed by Lyft, and sponsored by Nike. The program allows uses to rent bikes at any station throughout the city, ride, and then deposite the bike at any station.
The biketown program logs data on each ride, including start/end location and time, disance traveled, fair type (subscriber vs casual), and more. The data is uplaoded to the program’s website and then made publically available here.
Here is a the biketown.csv file of a sample of 9999 observations that I’ve been using in class Monday and Wednesday.
Week 2 Lab
Topics
- Graphics using
ggplot2
Lab Assignment
Labs are due by 11:59pm the day before your next lab meeting
Friday 2-4
Topics
- Exploring categorical and quantitative variables using summary statistics.
Reading Assignment
Note that the listed reading assignments should be completed prior to class
Sections to Read Sections 4.1, 4.3, 5.2 - 5.5 in Introduction to Modern Statistics Note this is not the ModernDive textbook
Reading Questions (Submit answers on Gradescope)
What are two different values that can be used to measure the center of a quantitative data set? What are two different values that can be used to measure the spread of a quantitative data set?
True or false? You can compute the mean of a categorical variable. Explain.
Week 3
Monday 2-7
Topics
Data Wrangling: The Verbs (Filter, Select, Mutate, Arrange, Summarize) and the Pipe
Supplementary Material
Here is an .Rmd file of solutionsto the day’s wrangling activity. And here is the output of the code.
Reading Assignment
Note that the listed reading assignments should be completed prior to class
Sections to Read Sections 3.1 - 3.6 in ModernDive
Reading Questions (Submit answers on Gradescope)
What is one “problem” the pipe operator solves when coding?
Answer LC3.2, LC3.6 from the text
Wednesday 2-9
Topics
Data Wrangling: More practice, advanced wrangling
Reading Assignment
Sections to Read Sections 3.8, 3.9, 4.1, 4.2 in ModernDive
Reading Questions (Submit answers on Gradescope)
Answer LC3.18, LC4.1 from the text
In addition to reading questions, please complete this anonymous survey for use in Wednesday’s class. You do not need to submit the survey results to gradescope.
Week 3 Lab
Topics
Data wrangling with
dplyrMore Data Wrangling .Rmd template
Modified my_starwars.csv
Lab Assignment
Friday 2-11
Topics
- Principles of Data Collection: samples, surveys, and experiments
Reading Assignment
Sections to Read Sections 2.1, 2.2 and 2.3 in Introduction to Modern Statistics
Reading Questions (Submit answers on Gradescope)
The website Rotten Tomatoes shows a proportion of audience respondents who were satisfied with a film. If a particular film has an audience score of 50%, do you think this means that 50% of all audience members are dissatisfied with the film? Why or why not?
For each of the following two research questions, what is the implied population and what represents an individual observation?
Have daily high temperature readings increased in Portland, OR over the past 20 years?
Does the Moderna COVID-19 vaccine reduce the death rate in patients with severe cases of COVID-19?
Week 4
Monday 2-14
Topics
- Correlation, Causation, Experiments, and Observational Studies
Reading Assignment
Note that the listed reading assignments should be completed prior to class
Sections to Read Review Sections 2.1 - 2.3 in Introduction to Modern Statistics (this was also the same reading as last Friday). Then spend some time exploring the Gapminder Bubbles Charts
Reading Questions (Submit answers on Gradescope)
On the Gapminder Bubbles Charts, change some of the variables on the x- and y-axes. What were some variables that seemed strongly correlated? Do you expect any of these variables to have a causal relationship? Explain.
Describe one interesting trend or observation you discovered using the Gapminder bubble charts.
Wednesday 2-16
- Note that around the 30-minute mark, my laptop ran out of batteries, and so there is a slight time skip (~2 minutes) until the recording came back online.
Topics
- Linear Models and the Least Squares Regression Line
Reading Assignment
Sections to Read Sections 7.1 - 7.2 in Introduction to Modern Statistics
Reading Questions (Submit answers on Gradescope)
Suppose the residual of an observation is negative, based on a certain linear model. Does this mean the model over-estimated or under-estimate the true value of the outcome?
A linear model to predict the cost of Reed tuition (in thousands of dollars) might be \[ \textrm{Cost} = 43 + 1.8 \cdot \textrm{Year} \] What do the values of the slope and intercept represent in the context of the model?
Friday 2-18
Topics
- More on linear modeling
Reading Assignment
Sections to Read Chapter 5 Intro and sections 5.1 and 5.3 in ModernDive
Reading Questions (Submit answers on Gradescope)
LC 5.1 (you don’t need to include your actual data or visualization, just your response to the question)
What is the largest difference between the treatment of Linear Regression in ModernDive Section 5.1 and its treatment in Intro to Modern Statistics Section 7.1. i.e.What are you able to do after reading ModernDive that you weren’t able to do with just Intro to Modern Stat?
Week 5
Monday 2-21
Topics
- Regression with categorical explanatory variables.
Reading Assignment
Note that the listed reading assignments should be completed prior to class
Sections to Read Section 5.2 in ModernDive
Reading Questions (Submit answers on Gradescope)
- In a linear regression model with quantitative response and categorical explanatory variable, why is there 1 fewer “slope” coefficients than there are levels of the categorical variable?
- LC 5.6
- What is one essential difference between regression models comparing 2 quantitative variables, and regression models comparing a quantitative and categorical variable?
Wednesday 2-23
Topics
- Multilinear Regression: One Categorical + One Quantitative Explanatory Variable
Reading Assignment
Note that the listed reading assignments should be completed prior to class
Sections to Read Section 6.1 in ModernDive
Reading Questions (Submit answers on Gradescope)
What is one essential difference between the interaction model and the parallel slopes model for multiple linear regression?
What is one conclusion we could draw from either the interaction or parallel slopes model for UT Austin evaluation scores in Section 6.1, that we could not draw from the simple linear model for UT Austin evaluation scores as a function of age (as in Section 5.1)?
Friday 2-25
Topics
Multilinear Regression: Geometry of the Model and Multiple Quantitative Response Variables
Reading Assignment
Note that the listed reading assignments should be completed prior to class
Sections to Read Section 6.2 in ModernDive
Reading Questions (Submit answers on Gradescope)
LC6.2 (You don’t need to include your data visualizations in your submission, just your answer to the question)
- Consider the following model for predicting a person’s weight (in kg) based on their height (in cm) and age (in years): \[ \hat{\textrm{Weight}} = -110 + 1 \cdot \textrm{Height} + 0.22 \cdot \textrm{Age} \]
- Interpret the coefficient 0.22 in the context of this model.
Week 6
Monday 2-28
Topics
Random Sampling
Reading Assignment
Note that the listed reading assignments should be completed prior to class
Sections to Read 7.1 and 7.2 in ModernDive
Reading Questions (Submit answers on Gradescope)
- LC 7.6, LC7.7
Wednesday 3-2
Topics
The Sampling Distribution
Reading Assignment
Note that the listed reading assignments should be completed prior to class
Sections to Read 7.3, 7.5 in ModernDive
Reading Questions (Submit answers on Gradescope)
- LC 7.13, 7.15, 7.17
Week 6 Lab
Topics
- Review for Midterm 1
Lab Assignment
Friday 3-4
Topics
- Review for Midterm 1
Reading Assignment
Note that the listed reading assignments should be completed prior to class
Sections to Read None
Reading Questions (Submit answers on Gradescope)
- Complete the “Practice with Timed Assignments” assignment on gradescope. Start by downloading this file Practice_with_Timed_Assignments_Template.Rmd and follow the instructions.
Week 7
Monday 3-7
Topics
- The Bootstrap
Reading Assignment
Note that the listed reading assignments should be completed prior to class
Sections to Read 8.1 and 8.2 in ModernDive (This reading is optional, and will be revisited on Wednesday’s class)
Reading Questions (Submit answers on Gradescope)
- None
Wednesday 3-9
Topics
- Introduction to Confidence Intervals
Reading Assignment
Note that the listed reading assignments should be completed prior to class
Sections to Read 8.3 in ModernDive (Review Sections 8.1 and 8.2 if you did not do so for Wednesday’s class)
Reading Questions (Submit answers on Gradescope)
- LC 8.1, 8.3
Week 7 Lab
Topics
- Sampling and Bootstrapping
Friday 3-11
Topics
- More on Confidence Intervals
Reading Assignment
Note that the listed reading assignments should be completed prior to class
Sections to Read 8.4 and 8.5 in ModernDive
Reading Questions (Submit answers on Gradescope)
What is one advantage offered by the
inferpackage method for bootstrap confidence intervals compared to the “original workflow” discussed at the start of Section 8.4?Assuming that you have to use the same sample either way, which confidence interval has a higher certainty of containing the population parameter: a wider interval or a narrow interval? Explain.
Week 8
Monday 3-14
Topics
- Hypothesis Testing Framework
Reading Assignment
Note that the listed reading assignments should be completed prior to class
Sections to Read 11.1 - 11.3 in Introduction to Modern Statistics
Reading Questions (Submit answers on Gradescope)
In your own words, briefly explain what the null distribution for a test statistic represents.
Suppose Nate has a coin that he flips repeatedly, recording the results each time. What type of evidence from a sequence of heads / tails would convince you that the coin is not fair?
Wednesday 3-16
Topics
- More on Hypothesis Testing
Reading Assignment
Note that the listed reading assignments should be completed prior to class
Sections to Read 9.1, 9.2 and 9.3 in ModernDive
Reading Questions (Submit answers on Gradescope)
In the study on gender and promotion rate in Section 9.1, what are two possible explanations for the observed difference in promotion rate in the sample?
LC 9.3
Week 8 Lab
Topics
- Confidence Intervals and Hypothesis Testing in
infer
Friday 3-18
Topics
Exploring Permutation Tests
Reading Assignment
Note that the listed reading assignments should be completed prior to class
Sections to Read 9.4 - 9.6 in ModernDive
Reading Questions (Submit answers on Gradescope)
- LC 9.7, LC 9.8
Spring Break
3/21 - 3/25
Week 9
Monday 3-28
Topics
Axioms of Probability
Conditional Probability
Reading Assignment
Note that the listed reading assignments should be completed prior to class
Sections to Read Section 3.1 and 3.2 in THIS EXCERPT from OpenIntro Statistics Note: This is neither the ModernDive textbook nor the Intro to Modern Statistics textbook.
Reading Questions (Submit answers on Gradescope)
- Briefly explain why the following situation is not a contradiction of the Law of Large Numbers:
“A fair coin is flipped 10 times and lands heads each time.”
Suppose a fair coin is flipped 10 times. What is the probability that all 10 flips are heads? What is the probability that either all 10 flips are heads or all 10 flips are tails?
Suppose a fair coin is flipped twice. What is the conditional probability that the second flip is a heads given that neither flip is tails?
Wednesday 3-30
Topics
- Random Variables
Reading Assignment
Note that the listed reading assignments should be completed prior to class
Sections to Read Section 3.4 - 3.5 in THIS EXCERPT from OpenIntro Statistics Note: This is neither the ModernDive textbook nor the Intro to Modern Statistics textbook.
Reading Questions (Submit answers on Gradescope)
In your own words, describe the difference between a quantitative variable and a random variable.
Give an example of a random process you think could be well-represented by a discrete random variable. Give an example of a different random process you think could be well-represented by a continuous random variable.
Suppose we model the length of a randomly selected earthworm as a continuous variable with mean 14 inches. What is the probability that the length of a randomly selected earthworm is exactly 14 inches? Explain.
Friday 4-1
Topics
- The Central Limit Theory and Probability Models
Reading Assignment
Note that the listed reading assignments should be completed prior to class
Sections to Read Sections 13.1 - 13.3 in Introduction to Modern Statistics
Reading Questions (Submit answers on Gradescope)
The Quincunx, bean machine, or ``Galton Board’’ was invented by 19th century English scientist Sir Francis Galton to demonstrate fundamental principles in probability and statistics. In its basic form, the Quincunx consists of an upright triangular board with evenly spaced pegs lying above evenly spaced bins. Balls are dropped one-by-one from a central chute at the top of the board and bounce either left or right as they hit the pegs. Eventually, they are collected in the bins at the bottom of the board.
Spend some time playing around with the Galton Board here. (After you adjust sliders, be sure to hit the “restart” button as well.)
Viewing the stacks of balls at the bottom of the board as a histogram, what named distribution is the histogram similar to?
What effect does increasing the size slider have on the shape of the histogram? What effect does increasing the Left/Right slider have on the shape?
What effect does increasing the Speed slider have on the shape?
During which time interval will the shape of the histogram change more? (a) between the 1st and the 100th balls, or (b) between the 901st and 1000th balls? Explain.
Week 10
Monday 4-4
Topics
- The Central Limit Theory and Probability Models
Reading Assignment
Note that the listed reading assignments should be completed prior to class
Sections to Read Review Sections 13.1 - 13.3 in Introduction to Modern Statistics from Friday
Reading Questions (Submit answers on Gradescope)
- None
Wednesday 4-6
Topics
- A Preview of Upcoming Statistics Classes
Reading Assignment
Note that the listed reading assignments should be completed prior to class
Sections to Read None
Reading Questions (Submit answers on Gradescope)
- None
Week 10 Lab
Topics
- The Central Limit Theorem and Normal Distributions
Friday 4-8
Topics
- Inference for Proportions
Reading Assignment
Note that the listed reading assignments should be completed prior to class
Sections to Read 16.1 - 16.2 in Introduction to Modern Statistics
Reading Questions (Submit answers on Gradescope)
Suppose you are interested in determining whether a majority of Americans disapprove of the US president. In a simple random sample of 100 Americans, you find that 60% disapprove of the current president, which gives a p-value of 0.02, and leads you to reject the null hypothesis. Explain what this means in everyday language in context of this problem.
Suppose we want to construct a confidence interval for a population proportion \(p\). Based on the Central Limit Theorem, the standard error of the sample proportion \(\hat p\) is \[ SE(\hat p) = \sqrt{\frac{p(1-p)}{n}} \] Explain why we cannot directly apply this formula to create the confidence interval for \(p\).
Week 11
Monday 4-11
Topics
- Inference comparing two proportions
Reading Assignment
Note that the listed reading assignments should be completed prior to class
Sections to Read 17.3 in Introduction to Modern Statistics
Reading Questions (Submit answers on Gradescope)
In order to perform hypothesis testing or create confidence intervals based on a difference in sample proportions \(\hat p_1 - \hat p_2\), we need to check 2 conditions. What are those conditions?
Suppose you perform two 2-sided hypothesis tests for a difference in proportion. In the first test, you obtain a test statistic of \(z = -2.05\) and in the second test, you obtain a test statistic of \(z = 0.04\). Which test gives better evidence to reject the null hypothesis? Explain.
Wednesday 4-13
Topics
- The \(t\)-distribution and inference for a single mean
Reading Assignment
Note that the listed reading assignments should be completed prior to class
Sections to Read 19.2 in Introduction to Modern Statistics
Reading Questions (Submit answers on Gradescope)
Describe at least 1 similarity and 1 difference between a t distribution and the standard Normal distribution.
Suppose you are interested in investigating the typical course load for Reed students. You obtain a random sample of 25 Reed students and record the number of credits each is currently taking as the variable
credits. If you want to perform inference using thecreditsvariable, is the parameter of interest a mean or a proportion? Explain how you know.
Week 11 Lab
Topics
- Theory-based Inference for Means and Proportions
Friday 4-15
Topics
- Inference for difference in means
Reading Assignment
Note that the listed reading assignments should be completed prior to class
Sections to Read 20.3, 20.4, 21.3 in Introduction to Modern Statistics
Reading Questions (Submit answers on Gradescope)
A study wishes to determine whether automatic and manual transmission cars have the same fuel efficiency. They randomly select 10 automatic cars and 10 manual cars, and measure number of gallons of gas consumed by each after a 100 mile trip. Write null and alternative hypotheses for this research question, both in words and in symbols.
Consider the following two experiments. Which has paired design and which corresponds to two independent samples? Explain how you know.
Does marijuana assist in injury recovery? A randomized experiment assigns subjects with sprained ankles into two groups: 10 receive a THC brownie every evening for 14 days, while another 10 receive an ordinary brownie every evening for the same period. The number of days until symptoms disappear is recorded for each subject.
A campus organization wants to determine whether listening to rock music before bed has an effect on length of sleep. They recruit 20 students and have them track the number of hours they sleep each night over a 14 day period. After these two weeks, the organization then instructs each of the 20 students to listen to rock music for 1 hour each night before going to sleep, and track the number of hours they get each night over a 14 day period. The organization records the average number of hours each student sleeps with and without rock music.
Week 12
Monday 4-18
Topics
- Inference for Simple Linear Regression
Reading Assignment
Note that the listed reading assignments should be completed prior to class
Sections to Read 24.1 - 24.6 in Introduction to Modern Statistics
Reading Questions (Submit answers on Gradescope)
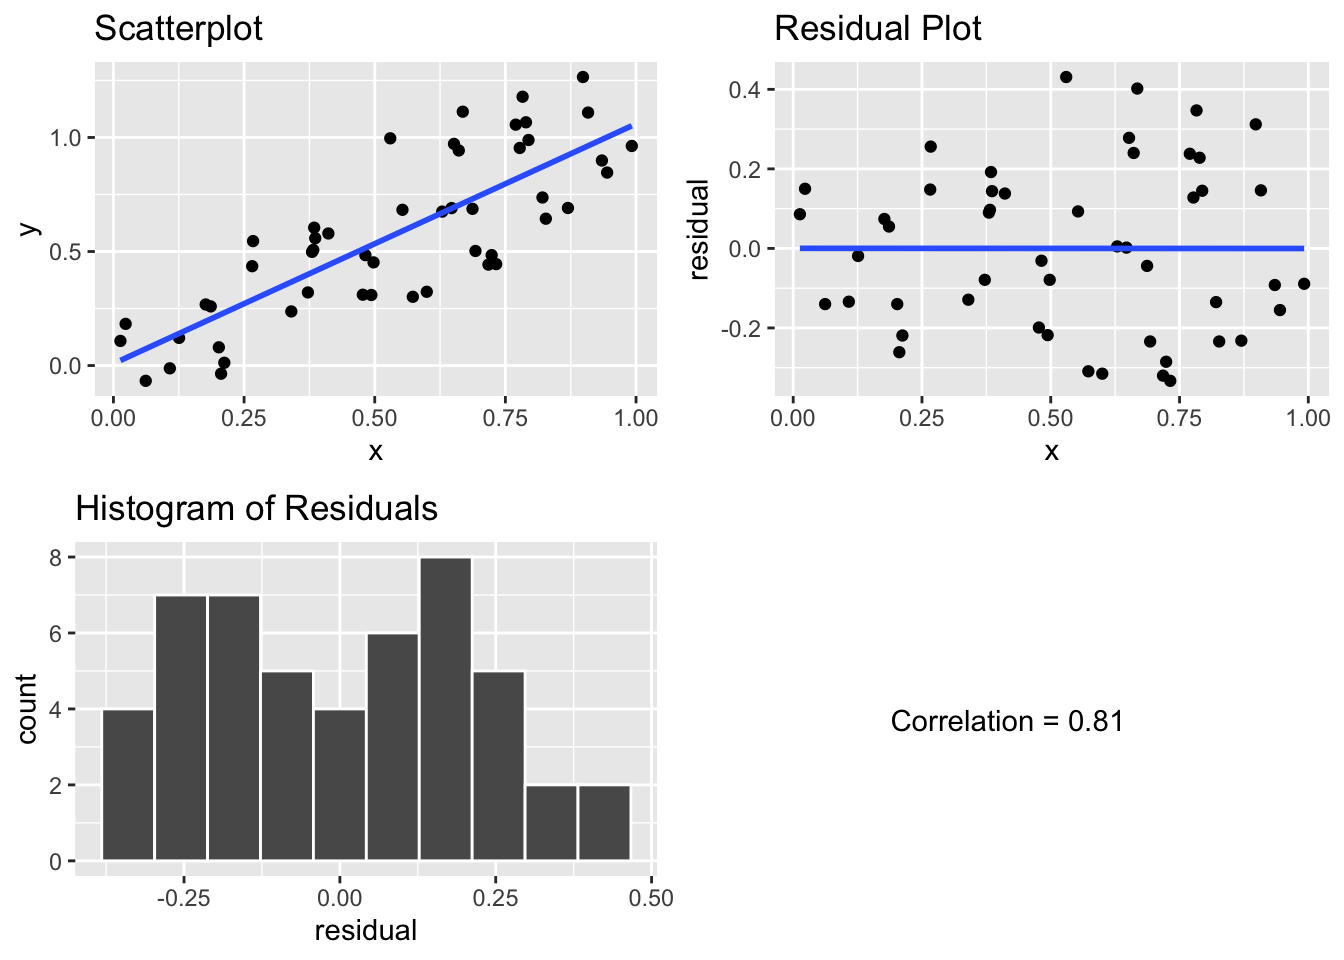
Consider two quantitative variables measured on a population of students:
lengthof index finger andheight. If these two variables are independent, and we repeatedly draw samples of 25 students from the population, computing the regression line for each, what do you anticipate will be the average slope for the regression line?The scatterplot, residual plot, and histogram of residuals for variables \(Y\) and \(X\) are shown below. Discuss any concerns you might have about whether the data satisfies the conditions for making inference about linear regression, based on these plots.
Wednesday 4-20
Topics
- Inference for MLR
Reading Assignment
Note that the listed reading assignments should be completed prior to class
Sections to Read 25.1, 25.2, 8.3, 8.4 in Introduction to Modern Statistics
Reading Questions (Submit answers on Gradescope)
Suppose we are interested in predicting college GPA based on high school GPA and SAT scores. We construct to linear models. The first model is of the form \[ \textrm{college GPA} = \beta_0 + \beta_1 \textrm{HS GPA} \] and the second model is of the form \[ \textrm{college GPA} = \beta_0 + \beta_1 \textrm{HS GPA} + \beta_2 \textrm{SAT} \] Suppose we wish to perform a hypothesis test for the slope on \(\textrm{HS GPA}\) in the two models. State the null hypothesis in each case, and explain the fundamental way in which these two hypotheses differ.
Based on the discussion in Section 8.3 and 8.4, what is one reason we may decide to use parsimonious model over the full model?
Friday 4-22
Topics
- Multilinear Regression Models
Reading Assignment
Note that the listed reading assignments should be completed prior to class
Sections to Read Review 25.1, 25.2, 8.3, 8.4 in Introduction to Modern Statistics (This was Wednesday’s reading)
Reading Questions (Submit answers on Gradescope)
- None
Week 13
Monday 4-25
Topics
- ANOVA
Reading Assignment
Note that the listed reading assignments should be completed prior to class
Sections to Read 22.1 - 22.3 in Introduction to Modern Statistics
Reading Questions (Submit answers on Gradescope)
Suppose you are interested in knowing whether a certain date in April is associated with higher than average number of births. To answer this question, you look at the average number of births for each of the 30 days, based data from 100 hospitals, and find that on April 23rd, there is a statistically significant difference at the 5% level in the number of births compared to the overall average. Explain why it would be incorrect to conclude that this gives good evidence that in general, there are more births on average on April 23rd? (Think about how many different tests you are performing at the 5% level)
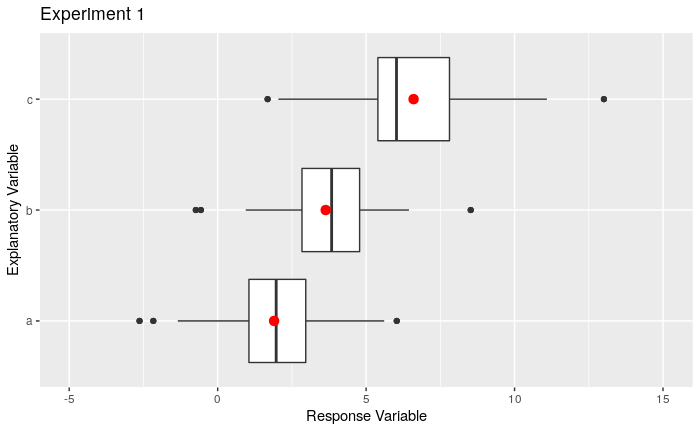
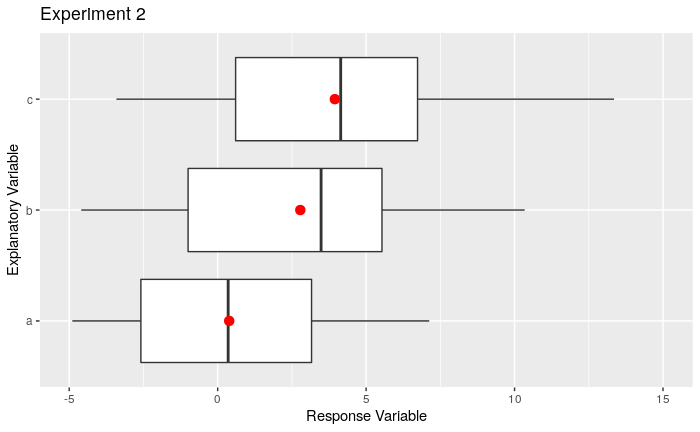
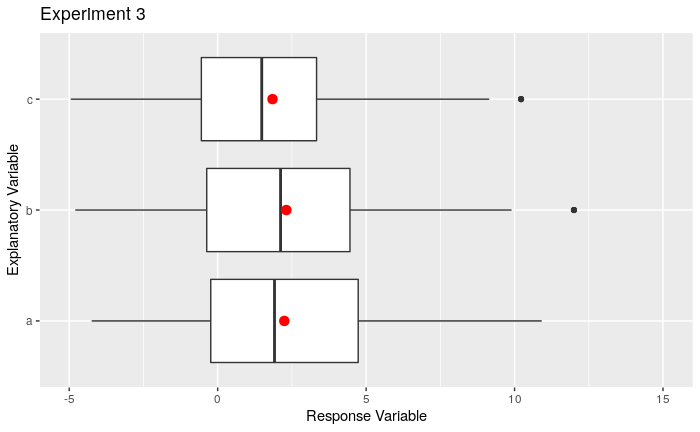
Consider the 3 sets of boxplots shown below. Which set gives the strongest evidence of a difference in means? Explain. Solid red dots in each box represent the means for each group
Wednesday 4-27
Topics
- Chi-Square Tests
Reading Assignment
Note that the listed reading assignments should be completed prior to class
Sections to Read 18.1 and 18.2 in Introduction to Modern Statistics
Reading Questions (Submit answers on Gradescope)
Describe 1 similarity and 1 difference between the Chi-Squared Test for Independence and the Hypothesis Test for Difference in 2 Proportions.
Consider 2 sections of Math 141. In total, 20% of students are first years, 30% of students are sophomores, 40% of students are juniors, and 10% of students are seniors. If section and year in school are independent, and there are 20 students in the 10am section of Math 141, what are the expected number of 1st Years, Sophomores, Juniors, and Seniors in the 10am section?
Week 13 Lab
Topics
- ANOVA and Multilinear Regression
Friday 4-29
Topics
Review
Course Summary
Reading Assignment
Note that the listed reading assignments should be completed prior to class
Sections to Read None
Reading Questions (Submit answers on Gradescope)
- None. But if you haven’t completed your course evaluations, please do so.